- Posts: 25
- Thank you received: 0
HUGE storm cycle brings 4-14 ft snow Feb6-25,2014!
- andybrnr
-

- User
-

Less
More
12 years 2 months ago #220262
by andybrnr
Replied by andybrnr on topic Re: Next major storm brings 4-6 ft snow Feb 6-14,2014!
Looking at the evolution of a single deterministic model run over several days lets us build what is called a "lagged ensemble", where each model run samples possible future states of the atmosphere. Variability from run to run reflects both model errors and uncertainty in initial conditions. While more recent runs in principle should receive more weight (they reflect more up-to-date initial conditions and shorter model integration to a specific future point in time), prior runs do help us understand how stable the solution is (more stable -> greater confidence that the forecast will verify), and in certain cases give a better idea of possible scenarios when the forecast is quite sensitive to small changes and there is great variability even at short lead times.
One step better, though, is to take advantage of calibrated ensemble forecasts, such as those available from the NAEFS. This approach uses 42 individual forecasts (20 from the NCEP GFS ensemble forecast, 20 from the Canadian ensemble system, plus a control run from each), that includes slight changes in model physics and initial conditions. By looking at the evolution of these runs from the same start time, we get a better sense of what the underlying uncertainty is. Let's look at the EPSgram for Seattle produced in the latest available forecast:

We have a depiction of predicted ranges during successive 12 hour periods for temperature, precip, wind, and cloud cover. The yellow bars give the range included within the middle quartiles of the distribution (25%-75%), whiskers give the most extreme members, and the black bar within the yellow is the median value. This isn't a perfect way to represent the ensemble forecast, as the interquartile spread and median are only really useful for a distribution of possibilities that is smooth with a single peak (unimodal), whereas the real distribution of outcomes at a point may look more bi-modal (a storm does or does not form/hit that point)... that said, it intuitively gives us a better appreciation of the range of possible outcomes. It also gives us a sense of the uncertainty of the forecast in the future based on how quickly the range within the whiskers/25-75% quartiles grows. While the details of a single deterministic forecast are almost certain to be wrong beyond 5 days or so, qualitative shifts in the ensemble forecast (e.g. wet to dry, warm to cold, etc.), which reflect changes in the large scale pattern, have shown pretty good skill at week or so long lead times in certain situations, such as major shifts in the location of the Pacific high and associated offshore ridge. Based on the above plot, it seems that the next week is quite likely to remain in a relatively stormy pattern. Freezing level fluctuations will be important in terms of figuring out exactly how well we do in improving the regional snowpack, but the temperatures don't look overly warm (correlating SEA surface temp with FRZ level is not the perfect way to do this, but it's a good zeroth order approach). Link to this tool is here .

Another nice way to view ensemble output is to look at probability of event occurrence on a map, where the event can be "temperature below freezing", "rain accumulation greater than X", etc., which is derived from the number of ensemble members for which the event is true at each location within a set time interval. The above map shows the probability of more than 1cm of accumulated precip (liquid water equivalent) over the 24 hour period from Feb. 12-13. If we increase the threshold to 2.5cm (an inch of liquid water equiv), we get this

high probabilities of decent precip. But what about the snowline?

For the same period, we see that the odds of surface temps along the mountains being significantly below freezing are marginal, so it's likely some portion of this precip will fall as rain at the passes. The model resolution for the ensemble is somewhat low, so mountainous terrain is not all that well resolved and thus this picture just reflects a somewhat higher freezing level. Link to the page for generating these figures is here .
Another output that's quite nice, recently added to the 4km UW WRF-GFS output, is the 3hr snow and rain imagery , which gives a sense of where snow line will be as the storms progress. Looks like the model trend has been towards higher snow levels over the last three or four runs based on D(model)/Dt, agreeing with the probability of freezing output from the ensemble shown above, but we will see. NAEFS shows the later systems trend colder, which the extended WRF-GFS 12km run agrees with, as well.
Andy
One step better, though, is to take advantage of calibrated ensemble forecasts, such as those available from the NAEFS. This approach uses 42 individual forecasts (20 from the NCEP GFS ensemble forecast, 20 from the Canadian ensemble system, plus a control run from each), that includes slight changes in model physics and initial conditions. By looking at the evolution of these runs from the same start time, we get a better sense of what the underlying uncertainty is. Let's look at the EPSgram for Seattle produced in the latest available forecast:
We have a depiction of predicted ranges during successive 12 hour periods for temperature, precip, wind, and cloud cover. The yellow bars give the range included within the middle quartiles of the distribution (25%-75%), whiskers give the most extreme members, and the black bar within the yellow is the median value. This isn't a perfect way to represent the ensemble forecast, as the interquartile spread and median are only really useful for a distribution of possibilities that is smooth with a single peak (unimodal), whereas the real distribution of outcomes at a point may look more bi-modal (a storm does or does not form/hit that point)... that said, it intuitively gives us a better appreciation of the range of possible outcomes. It also gives us a sense of the uncertainty of the forecast in the future based on how quickly the range within the whiskers/25-75% quartiles grows. While the details of a single deterministic forecast are almost certain to be wrong beyond 5 days or so, qualitative shifts in the ensemble forecast (e.g. wet to dry, warm to cold, etc.), which reflect changes in the large scale pattern, have shown pretty good skill at week or so long lead times in certain situations, such as major shifts in the location of the Pacific high and associated offshore ridge. Based on the above plot, it seems that the next week is quite likely to remain in a relatively stormy pattern. Freezing level fluctuations will be important in terms of figuring out exactly how well we do in improving the regional snowpack, but the temperatures don't look overly warm (correlating SEA surface temp with FRZ level is not the perfect way to do this, but it's a good zeroth order approach). Link to this tool is here .
Another nice way to view ensemble output is to look at probability of event occurrence on a map, where the event can be "temperature below freezing", "rain accumulation greater than X", etc., which is derived from the number of ensemble members for which the event is true at each location within a set time interval. The above map shows the probability of more than 1cm of accumulated precip (liquid water equivalent) over the 24 hour period from Feb. 12-13. If we increase the threshold to 2.5cm (an inch of liquid water equiv), we get this
high probabilities of decent precip. But what about the snowline?
For the same period, we see that the odds of surface temps along the mountains being significantly below freezing are marginal, so it's likely some portion of this precip will fall as rain at the passes. The model resolution for the ensemble is somewhat low, so mountainous terrain is not all that well resolved and thus this picture just reflects a somewhat higher freezing level. Link to the page for generating these figures is here .
Another output that's quite nice, recently added to the 4km UW WRF-GFS output, is the 3hr snow and rain imagery , which gives a sense of where snow line will be as the storms progress. Looks like the model trend has been towards higher snow levels over the last three or four runs based on D(model)/Dt, agreeing with the probability of freezing output from the ensemble shown above, but we will see. NAEFS shows the later systems trend colder, which the extended WRF-GFS 12km run agrees with, as well.
Andy
Please Log in or Create an account to join the conversation.
- Amar Andalkar
-
Topic Author
- User
-
Less
More
- Posts: 635
- Thank you received: 0
12 years 2 months ago - 12 years 2 months ago #220284
by Amar Andalkar
Replied by Amar Andalkar on topic Re: Next major storm brings 4-6 ft snow Feb 6-14,2014!
Thanks for the info Andy, those ensemble predictions are interesting, and not something I've previously paid much attention too.
I have really liked the 3hr snow and rain imagery since it was added (it's also available on the 1 1/3 km domain too) and look at it every time, that's a very useful tool during fluctuating snow levels like those over the next few days.
By the way, since you're a UW Atmos insider: is there some way you could ask them to generate the 12 km 700 mb temp-winds-heights graphics out to 180 hours instead of just 84? Most of the other 12 km graphics are generated out to 180 hours, but not that one. The 12 km 700 mb temp-winds-heights is by far the most useful tool I've found for predicting freezing levels and winds (especially their spatial and temporal variation) on the volcanoes during sunny periods when it's time to go big, and having to use the 36 km 700 mb temp-winds-heights graphics from 84-180 hours is not nearly as good. I tried sending a very nice email to David Ovens requesting that change (and also that the snowfall graphics be generated during June and September at least if not the whole summer, as they are currently turned off for several months), but have not heard back since that was sent in late November. Maybe he's really busy, I'm terrible at replying to email too.
Please Log in or Create an account to join the conversation.
- Amar Andalkar
-
Topic Author
- User
-
Less
More
- Posts: 635
- Thank you received: 0
12 years 2 months ago - 12 years 2 months ago #220285
by Amar Andalkar
Replied by Amar Andalkar on topic Re: Next major storm brings 4-6 ft snow Feb 6-14,2014!
Update #5: 120 hours after initial post, 2-6 ft has already fallen in Washington, Oregon, and California,
with an additional 4-8 ft of snow (or more) predicted over the next week for WA, OR, and southwest BC!
[size=small]Missed a decent powder day (with sunshine too!) at Crystal Mountain today -- the UW model's morning and evening runs yesterday predicted barely a couple inches new snowfall overnight at that location (it's in the rain shadow of Rainier), and only 1-2" had fallen by 10pm last night. Then awoke at 6:30am to shockingly see 6-8" new on the telemetry and webcam, a clear miss for the model at least on that fine scale -- but 6:30am is far too late to start getting ready and then leave Seattle on a Crystal powder day, it's best to be on the road no later than 6am. And I couldn't bring myself to try out the 17" new atop Alpental given the steady dose of rain and freezing rain on the lower elevations there. I guess on some days like this, it's fortunate that I can find intellectual pleasure in collecting snowfall data and analyzing snowfall forecasts, even when I miss out on actually skiing the new snow, and it's also nice to realize that I'll be happily skiing some of this same snow well into midsummer. But I'm having a hard time coming close to breaking even on my Crystal season pass again this year, given that I mostly tour instead of riding the lifts, and that lift-served conditions there were rarely worth the cost of gas from Seattle for the first 2 months of the season. Oh well, anyway, on to the update:[/size]
Another day later, and 2 more subsequent runs of the UW WRF-GFS model at 12-hour intervals continue to predict large snowfall amounts of 4-8 ft (and perhaps much more) over the next week for Washington and Oregon, in addition to 2-6 ft of snow which has already fallen over the past 5 days at most mountain sites from Mount Baker all the way south to Mammoth Mountain, a span of about 800 miles as the crow flies. The predicted amounts for both precip and snowfall over the next week remain similar to those predicted during the last 3 days, a good sign of stability in the model's predictions, with a continuing increase in overall totals as further storm systems come into view this weekend and into next week. If these predictions verify and the storm cycle continues as expected for another week or more, this will end up solidly in the HUGE storm cycle category with 10-day snowfall totals exceeding 10 ft at many sites especially above 4000-5000 ft in the Washington and northern Oregon Cascades plus southwestern BC.
The first stage of this storm cycle, aimed primarily at the Sierra Nevada (an atmospheric river) and also at Oregon and southern Washington (frontal snowfall along the boundary between a modified Arctic air mass and warmer air to the south), began early on Thursday, February 6, and ended during the day Monday, February 10. The next stage started early Monday morning and will extend throughout this week into the weekend, featuring a series of fronts and systems every 1-2 days in strong westerly and southwesterly flow over the north Pacific, aimed primarily at northern Oregon, Washington, and southwestern British Columbia.
The NWS's GFS model and their Quantitative Precipitation Forecasts continue to show up to 8-12" of precip over the next week for the mountains of southwestern BC, Washington, Oregon, and northwestern California, with much smaller amounts of only a fraction of an inch farther south in the Sierra. Here is total precipitation in inches predicted over the next 7 days through the morning of Tuesday, February 18:
The fire hose of the jet stream (see Days 1-5 Jet Stream Analysis & Forecasts ) will be aimed directly into the Pacific Northwest all week, perhaps peaking in intensity at almost 200 knots (about 230 mph) on Thursday afternoon, February 13, a significant increase in intensity from earlier predictions:
By Sunday the jet stream pattern is expected to have evolved and shifted, now approaching directly from the west -- a much better direction for large snowfall totals at much lower snow levels:
As of Tuesday morning, February 11, another 6-20" of new snow has fallen over the previous 24 hours throughout the Washington Cascades (even on the east side of the range), southwestern BC, and Mount Hood, with much lesser amounts of 1-2" farther south in the Oregon Cascades to Mount Bachelor. Snow levels varied from 2000-5000 ft north to south (and strongly depended on easterly pass flow until that diminished on Monday afternoon), and were initially about 6000 ft on Mount Hood before dropping to 5000 ft after the cold front passed through. This time the jackpot was solidly in the North Cascades, with over 20" new at Washington Pass and 12-18" new at the Chilliwack River BCRFC site (in the BC Cascades just north of the US border), Mount Baker, Mazama, Stevens Pass, Lake Wenatchee, and the top of Alpental, along with many SNOTEL sites throughout the North Cascades including Brown Top , Harts Pass , Rainy Pass , Park Creek Ridge , Lyman Lake , Trinity , etc. Farther north and south of the jackpot region, amounts were in the 6-10" range at Whistler, Hurricane Ridge, Crystal Mountain, Mount Rainier Paradise, White Pass, and Mount Hood. Throughout the Cascade Range, snow totals thus far since the storm cycle began early on February 6 range from 1.5 ft in the North Cascades and Mount Baker, 2 ft at Stevens Pass, 1.5 ft at Snoqualmie Pass (with 2.5 ft atop Alpental) and at Crystal, 2 ft at Mount Rainier Paradise, 3 ft at White Pass and Mount Hood, 3.5 ft on Mount Bachelor, 2 ft at Willamette Pass and Crater Lake, 1.5-2 ft on Mount Shasta, and roughly 2-4 ft on Lassen Peak (actual totals there are unknown due to a long-term outage at the 8250 ft Lake Helen telemetry site, plus the complete wintertime closure of the visitor center at the park's 6700 ft southwest entrance due to budget concerns, where daily snowfall measurements are normally taken).
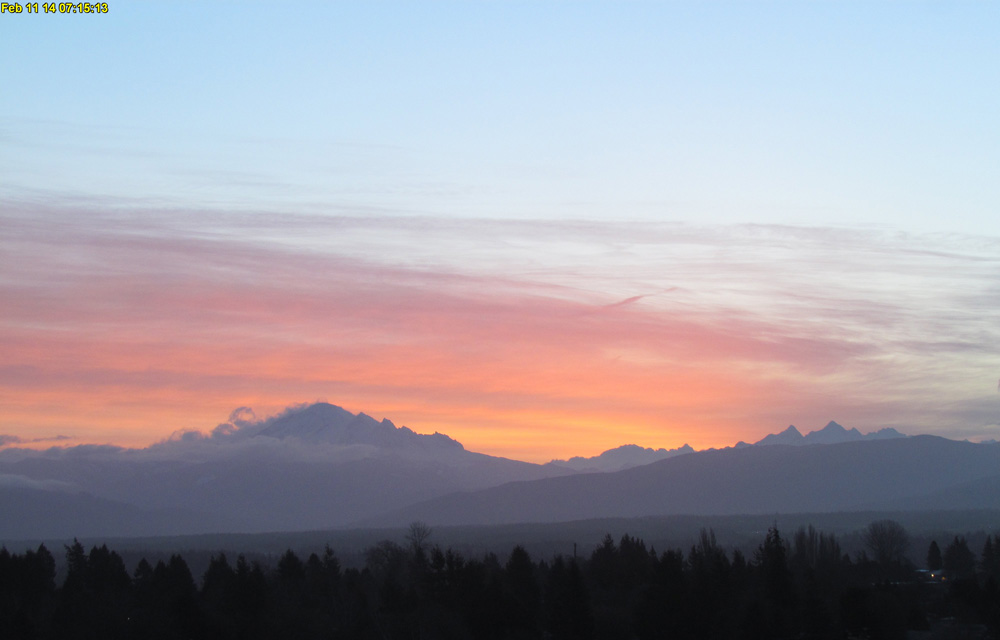
[size=small]Sunrise glow on Mount Baker and Twin Sisters Mountain after a night of heavy snowfall, as seen on the visibility camera from Ferndale .[/size]
There is a minor lull between systems during the day Tuesday, then the next much stronger and somewhat warmer system arrives later this afternoon and overnight through Wednesday. Another weaker system arrives Wednesday evening overnight into Thursday, followed by another lull and then a stronger system on Friday. Snowfall during the next 3 days through 4pm Friday is predicted to be 3-6 ft over the west slopes and volcanic peaks of the Washington and northern Oregon Cascades, the Olympics, and southwestern BC:
Higher resolution version of that, showing the Pacific Northwest and also zoomed in on Washington and Oregon:
Maximum snowfall amounts of 4-6 ft (marked by white inside yellow) are shown throughout the west slopes and volcanic peaks of the Olympics and Washington Cascades, parts of southwest BC, plus Mounts Hood, Jefferson, the Three Sisters, and even Newberry Volcano (shocking given that it's 30 miles east of the Cascade Crest and normally quite rain-shadowed) in Oregon. Some major volcanoes have been labeled on the last graphic for clarity.
This loop shows how the model predictions for snowfall during the 3-day period through 4pm Friday have evolved between 7 subsequent runs (2 missing) over the last 5 days, the D(model)/D(t). Very consistent in the overall picture throughout, with snowfall amounts increasing and decreasing a bit, but no major changes except that the bit of snow predicted for the Sierra on some runs has now vanished:
www.atmos.washington.edu/~ovens/wxloop.c...2+v2014021500///+-st
Additional snowfall during the subsequent 3 days ending 4pm next Monday is predicted to be another 3-6 ft over the west slopes and volcanic peaks of the Washington Cascades, Olympics, and southwestern BC, with 2-3 ft in the Oregon Cascades and perhaps several inches extending into the California Cascades and northern Sierra Nevada.
Beyond that point, it appears that this storm cycle is likely to continue to bring additional systems ashore every 1-2 days, producing continued precip and heavy snowfall into the start of next week and perhaps beyond. Additional snowfall during the 1 day period ending 4pm next Tuesday is predicted to be 2-3 ft over the Oregon and California Cascades, with 1-2 ft in the Washington Cascades and Olympics plus southwestern BC.
Details may certainly change as that period draws closer, as it is currently 6-7 days out, near the limit of accurate numerical weather prediction. But it puts the predicted 7.5-day snowfall totals at roughly 7-14 ft (!!) over the west slopes and volcanic peaks of the Washington Cascades, the Olympics, and southwestern BC, with about 5-12 ft in the Oregon Cascades and perhaps 2-4 ft in the California Cascades, all of that on top of the 2-6 ft that have already fallen. Awesome!
with an additional 4-8 ft of snow (or more) predicted over the next week for WA, OR, and southwest BC!
[size=small]Missed a decent powder day (with sunshine too!) at Crystal Mountain today -- the UW model's morning and evening runs yesterday predicted barely a couple inches new snowfall overnight at that location (it's in the rain shadow of Rainier), and only 1-2" had fallen by 10pm last night. Then awoke at 6:30am to shockingly see 6-8" new on the telemetry and webcam, a clear miss for the model at least on that fine scale -- but 6:30am is far too late to start getting ready and then leave Seattle on a Crystal powder day, it's best to be on the road no later than 6am. And I couldn't bring myself to try out the 17" new atop Alpental given the steady dose of rain and freezing rain on the lower elevations there. I guess on some days like this, it's fortunate that I can find intellectual pleasure in collecting snowfall data and analyzing snowfall forecasts, even when I miss out on actually skiing the new snow, and it's also nice to realize that I'll be happily skiing some of this same snow well into midsummer. But I'm having a hard time coming close to breaking even on my Crystal season pass again this year, given that I mostly tour instead of riding the lifts, and that lift-served conditions there were rarely worth the cost of gas from Seattle for the first 2 months of the season. Oh well, anyway, on to the update:[/size]
Another day later, and 2 more subsequent runs of the UW WRF-GFS model at 12-hour intervals continue to predict large snowfall amounts of 4-8 ft (and perhaps much more) over the next week for Washington and Oregon, in addition to 2-6 ft of snow which has already fallen over the past 5 days at most mountain sites from Mount Baker all the way south to Mammoth Mountain, a span of about 800 miles as the crow flies. The predicted amounts for both precip and snowfall over the next week remain similar to those predicted during the last 3 days, a good sign of stability in the model's predictions, with a continuing increase in overall totals as further storm systems come into view this weekend and into next week. If these predictions verify and the storm cycle continues as expected for another week or more, this will end up solidly in the HUGE storm cycle category with 10-day snowfall totals exceeding 10 ft at many sites especially above 4000-5000 ft in the Washington and northern Oregon Cascades plus southwestern BC.
The first stage of this storm cycle, aimed primarily at the Sierra Nevada (an atmospheric river) and also at Oregon and southern Washington (frontal snowfall along the boundary between a modified Arctic air mass and warmer air to the south), began early on Thursday, February 6, and ended during the day Monday, February 10. The next stage started early Monday morning and will extend throughout this week into the weekend, featuring a series of fronts and systems every 1-2 days in strong westerly and southwesterly flow over the north Pacific, aimed primarily at northern Oregon, Washington, and southwestern British Columbia.
The NWS's GFS model and their Quantitative Precipitation Forecasts continue to show up to 8-12" of precip over the next week for the mountains of southwestern BC, Washington, Oregon, and northwestern California, with much smaller amounts of only a fraction of an inch farther south in the Sierra. Here is total precipitation in inches predicted over the next 7 days through the morning of Tuesday, February 18:
The fire hose of the jet stream (see Days 1-5 Jet Stream Analysis & Forecasts ) will be aimed directly into the Pacific Northwest all week, perhaps peaking in intensity at almost 200 knots (about 230 mph) on Thursday afternoon, February 13, a significant increase in intensity from earlier predictions:
By Sunday the jet stream pattern is expected to have evolved and shifted, now approaching directly from the west -- a much better direction for large snowfall totals at much lower snow levels:
As of Tuesday morning, February 11, another 6-20" of new snow has fallen over the previous 24 hours throughout the Washington Cascades (even on the east side of the range), southwestern BC, and Mount Hood, with much lesser amounts of 1-2" farther south in the Oregon Cascades to Mount Bachelor. Snow levels varied from 2000-5000 ft north to south (and strongly depended on easterly pass flow until that diminished on Monday afternoon), and were initially about 6000 ft on Mount Hood before dropping to 5000 ft after the cold front passed through. This time the jackpot was solidly in the North Cascades, with over 20" new at Washington Pass and 12-18" new at the Chilliwack River BCRFC site (in the BC Cascades just north of the US border), Mount Baker, Mazama, Stevens Pass, Lake Wenatchee, and the top of Alpental, along with many SNOTEL sites throughout the North Cascades including Brown Top , Harts Pass , Rainy Pass , Park Creek Ridge , Lyman Lake , Trinity , etc. Farther north and south of the jackpot region, amounts were in the 6-10" range at Whistler, Hurricane Ridge, Crystal Mountain, Mount Rainier Paradise, White Pass, and Mount Hood. Throughout the Cascade Range, snow totals thus far since the storm cycle began early on February 6 range from 1.5 ft in the North Cascades and Mount Baker, 2 ft at Stevens Pass, 1.5 ft at Snoqualmie Pass (with 2.5 ft atop Alpental) and at Crystal, 2 ft at Mount Rainier Paradise, 3 ft at White Pass and Mount Hood, 3.5 ft on Mount Bachelor, 2 ft at Willamette Pass and Crater Lake, 1.5-2 ft on Mount Shasta, and roughly 2-4 ft on Lassen Peak (actual totals there are unknown due to a long-term outage at the 8250 ft Lake Helen telemetry site, plus the complete wintertime closure of the visitor center at the park's 6700 ft southwest entrance due to budget concerns, where daily snowfall measurements are normally taken).
[size=small]Sunrise glow on Mount Baker and Twin Sisters Mountain after a night of heavy snowfall, as seen on the visibility camera from Ferndale .[/size]
There is a minor lull between systems during the day Tuesday, then the next much stronger and somewhat warmer system arrives later this afternoon and overnight through Wednesday. Another weaker system arrives Wednesday evening overnight into Thursday, followed by another lull and then a stronger system on Friday. Snowfall during the next 3 days through 4pm Friday is predicted to be 3-6 ft over the west slopes and volcanic peaks of the Washington and northern Oregon Cascades, the Olympics, and southwestern BC:
Higher resolution version of that, showing the Pacific Northwest and also zoomed in on Washington and Oregon:
Maximum snowfall amounts of 4-6 ft (marked by white inside yellow) are shown throughout the west slopes and volcanic peaks of the Olympics and Washington Cascades, parts of southwest BC, plus Mounts Hood, Jefferson, the Three Sisters, and even Newberry Volcano (shocking given that it's 30 miles east of the Cascade Crest and normally quite rain-shadowed) in Oregon. Some major volcanoes have been labeled on the last graphic for clarity.
This loop shows how the model predictions for snowfall during the 3-day period through 4pm Friday have evolved between 7 subsequent runs (2 missing) over the last 5 days, the D(model)/D(t). Very consistent in the overall picture throughout, with snowfall amounts increasing and decreasing a bit, but no major changes except that the bit of snow predicted for the Sierra on some runs has now vanished:
www.atmos.washington.edu/~ovens/wxloop.c...2+v2014021500///+-st
Additional snowfall during the subsequent 3 days ending 4pm next Monday is predicted to be another 3-6 ft over the west slopes and volcanic peaks of the Washington Cascades, Olympics, and southwestern BC, with 2-3 ft in the Oregon Cascades and perhaps several inches extending into the California Cascades and northern Sierra Nevada.
Beyond that point, it appears that this storm cycle is likely to continue to bring additional systems ashore every 1-2 days, producing continued precip and heavy snowfall into the start of next week and perhaps beyond. Additional snowfall during the 1 day period ending 4pm next Tuesday is predicted to be 2-3 ft over the Oregon and California Cascades, with 1-2 ft in the Washington Cascades and Olympics plus southwestern BC.
Details may certainly change as that period draws closer, as it is currently 6-7 days out, near the limit of accurate numerical weather prediction. But it puts the predicted 7.5-day snowfall totals at roughly 7-14 ft (!!) over the west slopes and volcanic peaks of the Washington Cascades, the Olympics, and southwestern BC, with about 5-12 ft in the Oregon Cascades and perhaps 2-4 ft in the California Cascades, all of that on top of the 2-6 ft that have already fallen. Awesome!
Please Log in or Create an account to join the conversation.
- andybrnr
-
- User
-
Less
More
- Posts: 25
- Thank you received: 0
12 years 2 months ago #220286
by andybrnr
Replied by andybrnr on topic Re: Next major storm brings 4-6 ft snow Feb 6-14,2014!
I'll walk next door and ask him. I also nudged him on trying to find a better color scale for the 850mb temps, but he tossed that back to me as a project and I haven't gotten around to it. Just extending how far forward they're generated should be a trivial change, though. Cliff Mass keeps him pretty busy, so your e-mail probably just got buried under his to-do list. I also would like to keep the snow product around for a few extra months, I'll ask if we can keep it for June/Sept, at least.
The ensemble stuff is the way all weather forecasting will move in the future. It's an interesting research problem to figure out how to make all the data that comes out most useful/easily processed.
The ensemble stuff is the way all weather forecasting will move in the future. It's an interesting research problem to figure out how to make all the data that comes out most useful/easily processed.
Please Log in or Create an account to join the conversation.
- Amar Andalkar
-
Topic Author
- User
-
Less
More
- Posts: 635
- Thank you received: 0
12 years 2 months ago - 12 years 2 months ago #220334
by Amar Andalkar
Replied by Amar Andalkar on topic Re: Next major storm brings 4-6 ft snow Feb 6-14,2014!
Update #6: 144 hours after initial post, 2-6 ft has already fallen in southwest BC, Washington, Oregon, and California,
with an additional 4-8 ft of snow (or more) predicted over the next week for WA, OR, and southwest BC!
Another day later, and 2 more subsequent runs of the UW WRF-GFS model at 12-hour intervals continue to predict large snowfall amounts of 4-8 ft (and perhaps much more) over the next week for Washington, Oregon, and southwest BC, along with about 3-5 ft in northern California. This is in addition to 2-6 ft of snow which has already fallen over the past 6 days at most mountain sites from Bella Coola, BC, all the way south to Mammoth Mountain, a span of about 1100 miles as the crow flies (and well over 1500 miles by car). The predicted amounts for both precip and snowfall over the next week remain similar to those predicted during the last 3-4 days, a good sign of stability in the model's predictions, with a continuing increase in overall totals as further storm systems come into view this weekend and into next week. If these predictions verify and the storm cycle continues as expected for another week or more, this will end up solidly in the HUGE storm cycle category with 10-day snowfall totals exceeding 10 ft at many sites especially above 4000-5000 ft in the Washington and northern Oregon Cascades plus southwestern BC.
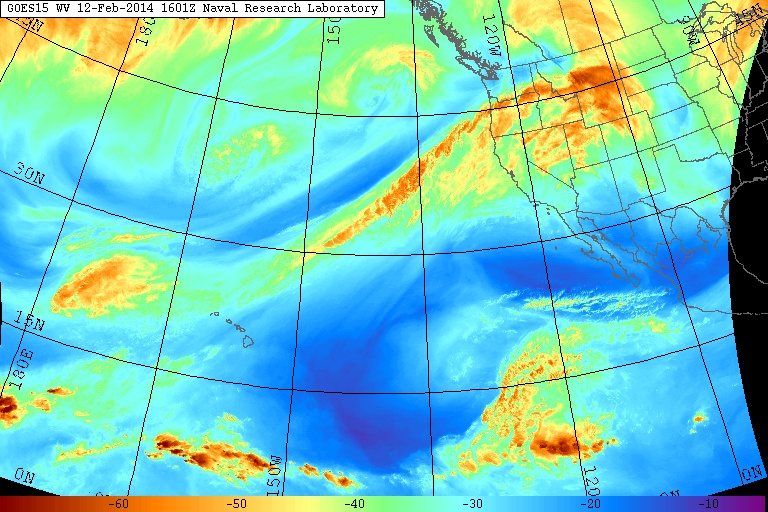
The first stage of this storm cycle, aimed primarily at the Sierra Nevada (an atmospheric river) and also at Oregon and southern Washington (frontal snowfall along the boundary between a modified Arctic air mass and warmer air to the south), began early on Thursday, February 6, and ended during the day Monday, February 10. The second stage of this storm cycle started early Monday morning and will extend throughout this week into the weekend, featuring a series of fronts and systems every 1-2 days in strong westerly and southwesterly flow over the north Pacific, aimed primarily at Oregon, Washington, and southwestern British Columbia. The first system of the second stage came ashore Monday morning, and the next much stronger system arrived in the same region on Tuesday afternoon, including another atmospheric river event aimed at Oregon, a few hundred miles farther north than the first atmospheric river aimed at the central Sierra Nevada. The water vapor satellite image from Wednesday morning (see www.nrlmry.navy.mil/sat-bin/epac_westcoast.cgi ) shows the plume of moisture aimed at northern Oregon:
This atmospheric river is expected to stay in place for the next 3-4 days while slowly shifting southward, weakening slightly by Thursday afternoon and more significantly by Saturday afternoon before it finally fades away on Sunday. Compare these graphics with the same ones in Update #4 above generated 2 days earlier, things look very similar to earlier predictions with only slight changes in the position and strength of the atmospheric river, eventually shifting a couple hundred miles farther south into northern California, which will bring some more precipitation to that area over the weekend:
The NWS's GFS model and their Quantitative Precipitation Forecasts continue to show up to 8-14" of precip over the next week for the mountains of southwestern BC, Washington, Oregon, and northwestern California, with much smaller amounts of only 1-3" extending farther south into the northern Sierra. Here is total precipitation in inches predicted over the next 7 days through the afternoon of Wednesday, February 19:
As of Wednesday morning, February 12, another 6-28" of new snow has fallen over the previous 24 hours at higher elevations throughout the Washington and Oregon Cascades, Olympics, and southwestern BC as far north as Bella Coola. Snow levels rose overnight and early Wednesday to about 2000 ft near Bella Coola, 4000 ft near Whistler, 5000 ft in the North Cascades, 6000 ft from Snoqualmie Pass south to White Pass, and 7000 ft throughout the Oregon Cascades, but were already beginning to drop quickly by Wednesday mid-morning from north to south as the ill-defined trailing cold front of this storm system passed through. This time the snowfall jackpot was in southwestern BC, with a claimed 28" new at Mount Washington (4500 ft) on Vancouver Island (which will reopen Thursday after being closed for the past 2 weeks due to insufficient snowpack), over 18" new at the Squamish River BCRFC site (4550 ft, west of Whistler), 16" at Spuzzum Creek BCRFC site (3950 ft, east of Harrison Lake), and 14" Whistler Mountain (5400 ft). In Washington and Oregon, the largest amounts were over 12" at Buckinghorse SNOTEL in the Olympics, 13" at Mount Baker Ski Area (4200 ft), 12" atop Alpental, 9-13" at Mount Bachelor (6300 and 7300 ft), and 10" at Crater Lake Rim (7050 ft). Mount Hood (and also Saint Helens) received over 3" of precipitation with about 6-8" new snow at Timberline at 5900 ft, but snowfall amounts of 2-3 ft were likely above 7000 ft.
Throughout the Cascade Range, Olympics, and southwestern BC, snow totals thus far since the storm cycle began early on February 6 range from 2 ft at the Burnt Bridge Creek (4400 ft, east of Bella Coola) and Squamish River BCRFC sites , 1.5 ft at Whistler, 1 ft at Hurricane Ridge, 2 ft at Buckinghorse SNOTEL , 2.5 ft at Mount Baker, 2 ft in much of the North Cascades, 2.5 ft at Stevens Pass, 2 ft at Snoqualmie Pass (with 3.5 ft atop Alpental), 1 ft at Mission Ridge, 2 ft at Crystal, 2.5 ft at Mount Rainier Paradise, 3.5 ft at White Pass and Mount Hood (with perhaps 5 ft above 7000 ft), 2.5 ft at Santiam Pass, 4.5 ft on Mount Bachelor, 2 ft at Willamette Pass, 2.5-3 ft at Crater Lake, 1.5-2 ft on Mount Shasta, and roughly 2-4 ft on Lassen Peak (actual totals there are unknown due to a long-term outage at the 8250 ft Lake Helen telemetry site, plus the complete wintertime closure of the visitor center at the park's 6700 ft southwest entrance due to budget concerns, where daily snowfall measurements are normally taken).
The strong system Tuesday night also featured very high winds, with maximum gusts of over 100 mph at Mission Ridge, Crystal Mountain, White Pass, and Mt Hood Meadows (Top of Cascade Express), with winds over 90 mph atop Alpental and at Camp Muir.
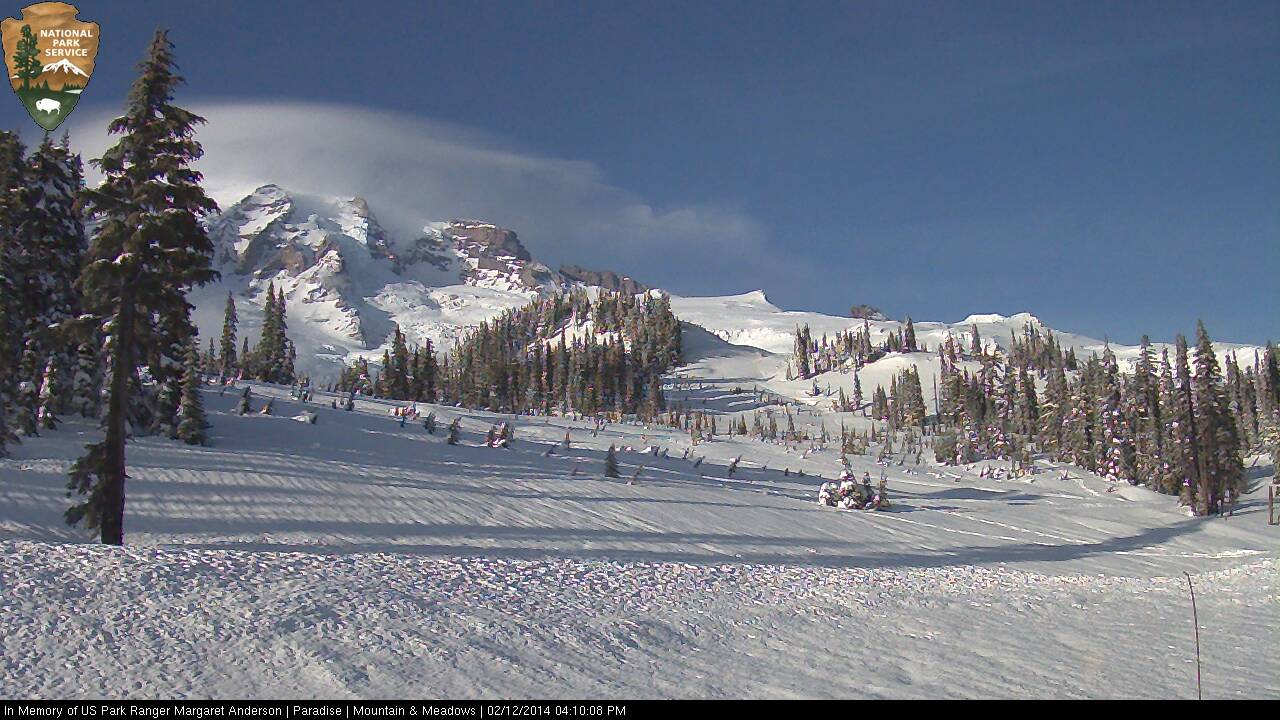
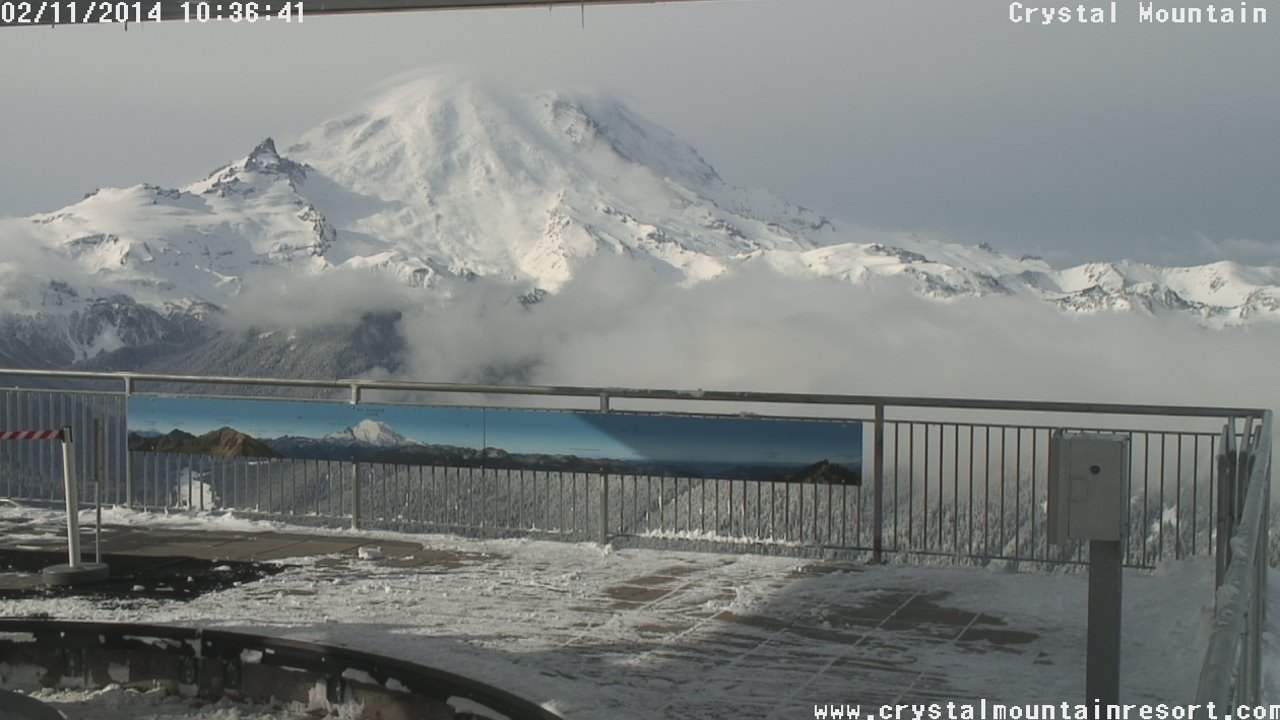
[size=small]The Mountain comes out on Wednesday afternoon during a lull between systems, capped by a lenticular cloud revealing the strong westerly winds aloft.[/size]
There is another minor lull between systems during the day Wednesday in Washington (not much of a lull in Oregon), then the next somewhat cooler system arrives later Wednesday evening and overnight through Thursday. Another lull on Thursday afternoon and evening, then the next stronger system arrives by midnight and continues through Friday. Yet another system is in the pipeline for Saturday. Snowfall during the next 3 days through 4pm Saturday is predicted to be 3-5 ft over the west slopes and volcanic peaks of the Washington and northern Oregon Cascades, the Olympics, and southwestern BC, with perhaps up to 1 ft extending into the California Cascades on Saturday:
Higher resolution version of that, showing the Pacific Northwest and also zoomed in on Washington and Oregon:
Maximum snowfall amounts of 4-5 ft (marked by white inside yellow) are shown along the west slopes of the Olympics and the volcanic peaks of the Washington and Oregon Cascades. In Oregon, even Newberry Volcano and Yamsay Mountain (another large shield volcano east of Crater Lake, the highest volcano in the eastern Cascade chain at 8196 ft) are shown with 3-4 ft expected, shocking given that both are 30 miles east of the Cascade Crest and normally quite rain-shadowed! Some major volcanoes have been labeled on the last graphic for clarity.
This loop shows how the model predictions for snowfall during the 3-day period through 4pm Saturday have evolved between 7 subsequent runs (2 missing) over the last 5 days, the D(model)/D(t). Very consistent in the overall picture throughout, with snowfall amounts increasing and decreasing a bit, but no major changes except for a trend towards more snowfall in the California Cascades on the latest runs:
www.atmos.washington.edu/~ovens/wxloop.c...2+v2014021600///+-st
Additional snowfall during the subsequent 3 days ending 4pm next Tuesday is predicted to be another 3-6 ft over the west slopes and volcanic peaks of the Washington and Oregon Cascades, Olympics, and southwestern BC, with 2-3 ft now extending into the California Cascades, Trinity Alps, and northern Sierra Nevada. These systems over the weekend are also likely to feature somewhat lower snow levels than the systems thus far this week.
Beyond that point, it appears that this storm cycle is likely to continue to bring additional systems ashore every 1-2 days, producing continued precip and heavy snowfall into the middle of next week and perhaps beyond. Additional snowfall during the 1 day period ending 4pm next Wednesday is predicted to be 1-2 ft over the Washington, Oregon, and California Cascades, along with the Klamath Mountains and much of the Sierra Nevada.
Details may certainly change as that period draws closer, as it is currently 6-7 days out, near the limit of accurate numerical weather prediction. But it puts the predicted 7.5-day snowfall totals (once again!) at roughly 7-14 ft (!!) over the west slopes and volcanic peaks of the Washington and Oregon Cascades, with about 5-12 ft in the Olympics and southwestern BC, and perhaps 3-5 ft in the California Cascades and northern Sierra Nevada, all of that on top of the 2-6 ft that have already fallen. Outstanding!
What about the longer term? A definite end to this storm cycle is not yet in sight. The extended GFS model out to 384 hours (16 days) shows additional storm systems throughout the 8-16 day period. This is the predicted 24-hour precip, click "Loop All" to see all the graphics (3 hour intervals up to 192 hours, 12 hour intervals beyond that):
GFS, North Pacific, 02/12/2014 18UTC, precip_p24
The Climate Prediction Center's 6-10 and 8-14 Day Outlooks also look promising, with a high likelihood for continued above normal precipitation at below normal temperatures in the Pacific Northwest, while the extreme cold in the eastern US looks to be over soon:
with an additional 4-8 ft of snow (or more) predicted over the next week for WA, OR, and southwest BC!
Another day later, and 2 more subsequent runs of the UW WRF-GFS model at 12-hour intervals continue to predict large snowfall amounts of 4-8 ft (and perhaps much more) over the next week for Washington, Oregon, and southwest BC, along with about 3-5 ft in northern California. This is in addition to 2-6 ft of snow which has already fallen over the past 6 days at most mountain sites from Bella Coola, BC, all the way south to Mammoth Mountain, a span of about 1100 miles as the crow flies (and well over 1500 miles by car). The predicted amounts for both precip and snowfall over the next week remain similar to those predicted during the last 3-4 days, a good sign of stability in the model's predictions, with a continuing increase in overall totals as further storm systems come into view this weekend and into next week. If these predictions verify and the storm cycle continues as expected for another week or more, this will end up solidly in the HUGE storm cycle category with 10-day snowfall totals exceeding 10 ft at many sites especially above 4000-5000 ft in the Washington and northern Oregon Cascades plus southwestern BC.
The first stage of this storm cycle, aimed primarily at the Sierra Nevada (an atmospheric river) and also at Oregon and southern Washington (frontal snowfall along the boundary between a modified Arctic air mass and warmer air to the south), began early on Thursday, February 6, and ended during the day Monday, February 10. The second stage of this storm cycle started early Monday morning and will extend throughout this week into the weekend, featuring a series of fronts and systems every 1-2 days in strong westerly and southwesterly flow over the north Pacific, aimed primarily at Oregon, Washington, and southwestern British Columbia. The first system of the second stage came ashore Monday morning, and the next much stronger system arrived in the same region on Tuesday afternoon, including another atmospheric river event aimed at Oregon, a few hundred miles farther north than the first atmospheric river aimed at the central Sierra Nevada. The water vapor satellite image from Wednesday morning (see www.nrlmry.navy.mil/sat-bin/epac_westcoast.cgi ) shows the plume of moisture aimed at northern Oregon:
This atmospheric river is expected to stay in place for the next 3-4 days while slowly shifting southward, weakening slightly by Thursday afternoon and more significantly by Saturday afternoon before it finally fades away on Sunday. Compare these graphics with the same ones in Update #4 above generated 2 days earlier, things look very similar to earlier predictions with only slight changes in the position and strength of the atmospheric river, eventually shifting a couple hundred miles farther south into northern California, which will bring some more precipitation to that area over the weekend:
The NWS's GFS model and their Quantitative Precipitation Forecasts continue to show up to 8-14" of precip over the next week for the mountains of southwestern BC, Washington, Oregon, and northwestern California, with much smaller amounts of only 1-3" extending farther south into the northern Sierra. Here is total precipitation in inches predicted over the next 7 days through the afternoon of Wednesday, February 19:
As of Wednesday morning, February 12, another 6-28" of new snow has fallen over the previous 24 hours at higher elevations throughout the Washington and Oregon Cascades, Olympics, and southwestern BC as far north as Bella Coola. Snow levels rose overnight and early Wednesday to about 2000 ft near Bella Coola, 4000 ft near Whistler, 5000 ft in the North Cascades, 6000 ft from Snoqualmie Pass south to White Pass, and 7000 ft throughout the Oregon Cascades, but were already beginning to drop quickly by Wednesday mid-morning from north to south as the ill-defined trailing cold front of this storm system passed through. This time the snowfall jackpot was in southwestern BC, with a claimed 28" new at Mount Washington (4500 ft) on Vancouver Island (which will reopen Thursday after being closed for the past 2 weeks due to insufficient snowpack), over 18" new at the Squamish River BCRFC site (4550 ft, west of Whistler), 16" at Spuzzum Creek BCRFC site (3950 ft, east of Harrison Lake), and 14" Whistler Mountain (5400 ft). In Washington and Oregon, the largest amounts were over 12" at Buckinghorse SNOTEL in the Olympics, 13" at Mount Baker Ski Area (4200 ft), 12" atop Alpental, 9-13" at Mount Bachelor (6300 and 7300 ft), and 10" at Crater Lake Rim (7050 ft). Mount Hood (and also Saint Helens) received over 3" of precipitation with about 6-8" new snow at Timberline at 5900 ft, but snowfall amounts of 2-3 ft were likely above 7000 ft.
Throughout the Cascade Range, Olympics, and southwestern BC, snow totals thus far since the storm cycle began early on February 6 range from 2 ft at the Burnt Bridge Creek (4400 ft, east of Bella Coola) and Squamish River BCRFC sites , 1.5 ft at Whistler, 1 ft at Hurricane Ridge, 2 ft at Buckinghorse SNOTEL , 2.5 ft at Mount Baker, 2 ft in much of the North Cascades, 2.5 ft at Stevens Pass, 2 ft at Snoqualmie Pass (with 3.5 ft atop Alpental), 1 ft at Mission Ridge, 2 ft at Crystal, 2.5 ft at Mount Rainier Paradise, 3.5 ft at White Pass and Mount Hood (with perhaps 5 ft above 7000 ft), 2.5 ft at Santiam Pass, 4.5 ft on Mount Bachelor, 2 ft at Willamette Pass, 2.5-3 ft at Crater Lake, 1.5-2 ft on Mount Shasta, and roughly 2-4 ft on Lassen Peak (actual totals there are unknown due to a long-term outage at the 8250 ft Lake Helen telemetry site, plus the complete wintertime closure of the visitor center at the park's 6700 ft southwest entrance due to budget concerns, where daily snowfall measurements are normally taken).
The strong system Tuesday night also featured very high winds, with maximum gusts of over 100 mph at Mission Ridge, Crystal Mountain, White Pass, and Mt Hood Meadows (Top of Cascade Express), with winds over 90 mph atop Alpental and at Camp Muir.
[size=small]The Mountain comes out on Wednesday afternoon during a lull between systems, capped by a lenticular cloud revealing the strong westerly winds aloft.[/size]
There is another minor lull between systems during the day Wednesday in Washington (not much of a lull in Oregon), then the next somewhat cooler system arrives later Wednesday evening and overnight through Thursday. Another lull on Thursday afternoon and evening, then the next stronger system arrives by midnight and continues through Friday. Yet another system is in the pipeline for Saturday. Snowfall during the next 3 days through 4pm Saturday is predicted to be 3-5 ft over the west slopes and volcanic peaks of the Washington and northern Oregon Cascades, the Olympics, and southwestern BC, with perhaps up to 1 ft extending into the California Cascades on Saturday:
Higher resolution version of that, showing the Pacific Northwest and also zoomed in on Washington and Oregon:
Maximum snowfall amounts of 4-5 ft (marked by white inside yellow) are shown along the west slopes of the Olympics and the volcanic peaks of the Washington and Oregon Cascades. In Oregon, even Newberry Volcano and Yamsay Mountain (another large shield volcano east of Crater Lake, the highest volcano in the eastern Cascade chain at 8196 ft) are shown with 3-4 ft expected, shocking given that both are 30 miles east of the Cascade Crest and normally quite rain-shadowed! Some major volcanoes have been labeled on the last graphic for clarity.
This loop shows how the model predictions for snowfall during the 3-day period through 4pm Saturday have evolved between 7 subsequent runs (2 missing) over the last 5 days, the D(model)/D(t). Very consistent in the overall picture throughout, with snowfall amounts increasing and decreasing a bit, but no major changes except for a trend towards more snowfall in the California Cascades on the latest runs:
www.atmos.washington.edu/~ovens/wxloop.c...2+v2014021600///+-st
Additional snowfall during the subsequent 3 days ending 4pm next Tuesday is predicted to be another 3-6 ft over the west slopes and volcanic peaks of the Washington and Oregon Cascades, Olympics, and southwestern BC, with 2-3 ft now extending into the California Cascades, Trinity Alps, and northern Sierra Nevada. These systems over the weekend are also likely to feature somewhat lower snow levels than the systems thus far this week.
Beyond that point, it appears that this storm cycle is likely to continue to bring additional systems ashore every 1-2 days, producing continued precip and heavy snowfall into the middle of next week and perhaps beyond. Additional snowfall during the 1 day period ending 4pm next Wednesday is predicted to be 1-2 ft over the Washington, Oregon, and California Cascades, along with the Klamath Mountains and much of the Sierra Nevada.
Details may certainly change as that period draws closer, as it is currently 6-7 days out, near the limit of accurate numerical weather prediction. But it puts the predicted 7.5-day snowfall totals (once again!) at roughly 7-14 ft (!!) over the west slopes and volcanic peaks of the Washington and Oregon Cascades, with about 5-12 ft in the Olympics and southwestern BC, and perhaps 3-5 ft in the California Cascades and northern Sierra Nevada, all of that on top of the 2-6 ft that have already fallen. Outstanding!
What about the longer term? A definite end to this storm cycle is not yet in sight. The extended GFS model out to 384 hours (16 days) shows additional storm systems throughout the 8-16 day period. This is the predicted 24-hour precip, click "Loop All" to see all the graphics (3 hour intervals up to 192 hours, 12 hour intervals beyond that):
GFS, North Pacific, 02/12/2014 18UTC, precip_p24
The Climate Prediction Center's 6-10 and 8-14 Day Outlooks also look promising, with a high likelihood for continued above normal precipitation at below normal temperatures in the Pacific Northwest, while the extreme cold in the eastern US looks to be over soon:
Please Log in or Create an account to join the conversation.
- Amar Andalkar
-
Topic Author
- User
-
Less
More
- Posts: 635
- Thank you received: 0
12 years 2 months ago #220345
by Amar Andalkar
Yeah, I've often lamented the 850 mb color scale, and why it was the same as the 700 mb -- which leaves the higher-res, zoomed-in 850 mb plots awash in a sea of similar-looking yellows and oranges much of the time under typical Northwest conditions. Since the color scale shifts by +27 °C from 300 mb to 500 mb, and by what appears to be roughly +12 to +21°C (with a slope change) going to 700 mb, I think another shift going to 850 mb would be appropriate. It appears that the 700 mb scale "works" the best of all those scales, because temps that are warm perceptually in the mountains look "warm" color-wise on the plot, and temps that are cold look "cold". The 850 mb scale falls short for the same reason, but fixing it may be as easy as a +9°C (or +10 °C) shift in scale. This is also the right amount of shift given the standard lapse rate of about 2 °C per 300 m, and the roughly 1500 m difference in normal 700 and 850 mb levels. There may be a better more complex fix than that, but the simple shift would help a lot.
Replied by Amar Andalkar on topic Re: Next major storm brings 4-6 ft snow Feb 6-14,2014!
I'll walk next door and ask him. I also nudged him on trying to find a better color scale for the 850mb temps, but he tossed that back to me as a project and I haven't gotten around to it. Just extending how far forward they're generated should be a trivial change, though. Cliff Mass keeps him pretty busy, so your e-mail probably just got buried under his to-do list. I also would like to keep the snow product around for a few extra months, I'll ask if we can keep it for June/Sept, at least.
The ensemble stuff is the way all weather forecasting will move in the future. It's an interesting research problem to figure out how to make all the data that comes out most useful/easily processed.
Yeah, I've often lamented the 850 mb color scale, and why it was the same as the 700 mb -- which leaves the higher-res, zoomed-in 850 mb plots awash in a sea of similar-looking yellows and oranges much of the time under typical Northwest conditions. Since the color scale shifts by +27 °C from 300 mb to 500 mb, and by what appears to be roughly +12 to +21°C (with a slope change) going to 700 mb, I think another shift going to 850 mb would be appropriate. It appears that the 700 mb scale "works" the best of all those scales, because temps that are warm perceptually in the mountains look "warm" color-wise on the plot, and temps that are cold look "cold". The 850 mb scale falls short for the same reason, but fixing it may be as easy as a +9°C (or +10 °C) shift in scale. This is also the right amount of shift given the standard lapse rate of about 2 °C per 300 m, and the roughly 1500 m difference in normal 700 and 850 mb levels. There may be a better more complex fix than that, but the simple shift would help a lot.
Please Log in or Create an account to join the conversation.