- Posts: 116
- Thank you received: 0
WSDOT - Only 80" of Snow at Snoq Pass this Winter
- TomK
-

- User
-

Less
More
11 years 4 months ago - 11 years 4 months ago #224280
by TomK
Replied by TomK on topic Re: WSDOT - Only 80" of Snow at Snoq Pass this Winter
Looking at rolling 3,4,& 5 year averages trend for a set of Hyak data going back to 1930, this current decade is still better than 1939-49 when every year was below average.
That said, his winter is shaping up to be a mirror of the big winter of 55/56, setting a record for the lowest snowfall.
Is this the ratchet effect, or a long term trend? We won't know for a few more winters.
That said, his winter is shaping up to be a mirror of the big winter of 55/56, setting a record for the lowest snowfall.
Is this the ratchet effect, or a long term trend? We won't know for a few more winters.
Please Log in or Create an account to join the conversation.
- flowing alpy
-
- User
-
Less
More
- Posts: 1272
- Thank you received: 0
11 years 4 months ago #224284
by flowing alpy
Replied by flowing alpy on topic Re: WSDOT - Only 80" of Snow at Snoq Pass this Winter
i got time to wait this one out. now silas, he's just doing his same old thing but with different chicks probably.
Please Log in or Create an account to join the conversation.
- Amar Andalkar
-
- User
-
Less
More
- Posts: 635
- Thank you received: 0
11 years 4 months ago - 11 years 4 months ago #224285
by Amar Andalkar
Come on folks, it's well known by now that this is a completely artificial effect, which occurs because that set of data is cut-off at 1950. So it accidentally starts with a bunch of huge snowfall years during the fattest part of the Pacific Decadal Oscillation (PDO) cycle, and leaves out a bunch of terrible low-snowfall years right before 1950. Extending the data set back as far as it exists makes this artificial effect vanish. Here is a plot of all available snowfall data at Snoqualmie Pass back to 1910, with several running averages superimposed:
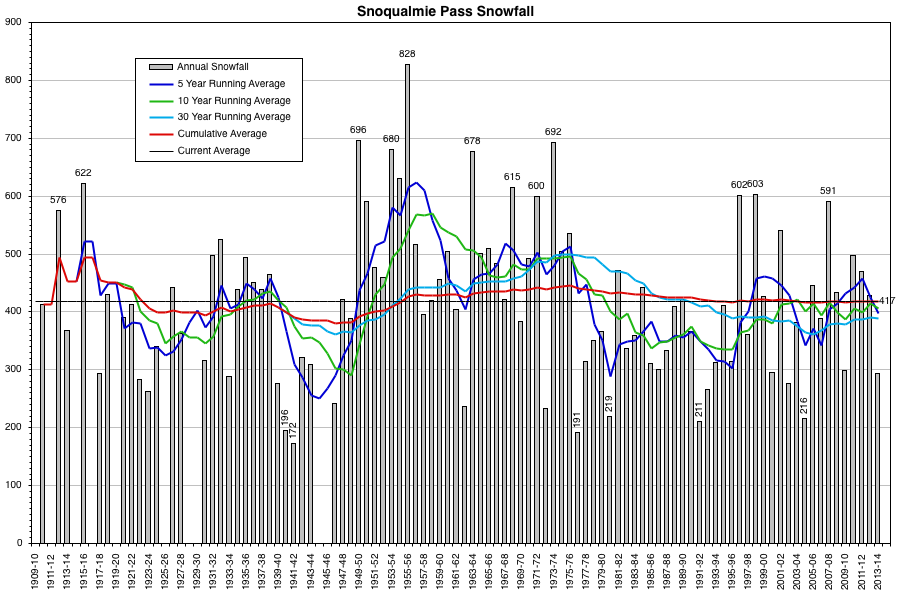
Clearly the full cumulative average (red line) shows no such steady decline! It trends downward throughout the 1920s, increases a bit in the 1930s, decreases sharply again in the 1940s, then increases over the next 25 years through the mid 1970s, then decreases again until the mid 1990s, and finally holds almost steady for the last 2 decades, with increases in big years offset by decreases in other years (the cumulative average is 417" as of 1996 and still 417" after 2014).
The other long-term running averages over 10 and 30 year periods also show no such decline. If you look at the average snowfall in each calendar decade, it is also clear that no steady decline has occurred:
[tt]
1910-1920 450"
1920-1930 356"
1930-1940 419"
1940-1950 343"
1950-1960 545"
1960-1970 474"
1970-1980 428"
1980-1990 361"
1990-2000 388"
2000-2010 387"
[/tt]
Regarding the 10 missing years that are not shown in the plot: most of those years are missing only 1 or 2 months of data during the crucial November-April period when about 98% of the annual snowfall at this location occurs. However, it seems best not to include such years in order to avoid skewing the averages. Of the 10 years not shown on the graph, 4 of them are actually really bad snow years, even assuming normal or heavy snowfall during the 1-2 missing months (1914-15, 1925-26, 1944-45, and 1945-46), while only 2 are near-normal (1911-12 and 1916-17) and the other 4 of them are missing most of the data for the entire season (1909-10, 1919-20, 1928-29, 1929-30). Therefore including the 6 near-complete years would only further reinforce what the plot already shows, that snowfall was far less than the long-term average during the 1920s and 1940s.
The older Snoqualmie Pass data is available from the Western Regional Climate Center at www.wrcc.dri.edu/cgi-bin/cliMONtsnf.pl?wa7781 . There are slight discrepancies from the WSDOT data during the period that they overlap, but in general it's a pretty good match within a few %, as good as can be expected in such snowfall data. Note that the listed annual totals in the original WRCC data have a major flaw: when any month is missing more than 5 days, they don't count it at all in annual totals, which undercounts the totals severely in many years. Although it is proper to leave out partial months when calculating monthly averages, it is erroneous to leave out partial months in sums such as annual totals for cumulative quantities like snowfall or precip, since leaving those out makes the listed annual totals more wrong than including them does. I'm not sure how WRCC could make such a significant mathematical blunder in all of their data for all sites, but it's been like that for as long as I've been looking at the WRCC data (over 10 years).
So my listed annual totals do include such partial months, although if too much is missing in any year especially in the important big-snowfall months, I leave the annual total blank as mentioned above. But I have not yet gone through the original daily snowfall records for Snoqualmie Pass from the National Climatic Data Center in order to manually clean up any other errors that might be found in the older data (I usually do this at some point for most sites that I track snowfall data for, but it's a big pain).
For those who wish to see the complete Snoqualmie Pass data set, for pure interest and also to verify that no chicanery or manipulation occurred in the graph above, here it is as a screen capture from my original spreadsheet (I'd prefer not to post the original Excel spreadsheet online):
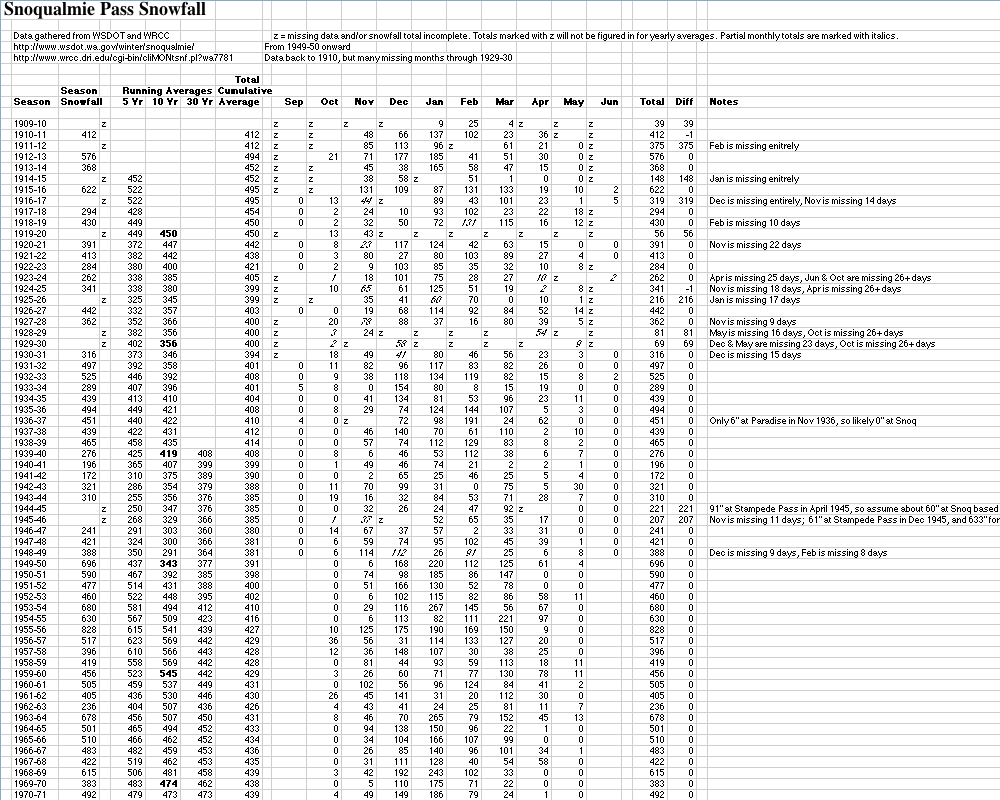
Note that all of this data (WSDOT and WRCC and TomK's data shown in a previous post) is from the summit of Snoqualmie Pass near 3000 ft (3010 or 3020 ft), none of it is from Hyak (2600 ft) despite what various files online may say. The confusion may arise because WSDOT has a maintenance / operations center at Hyak. However, snowfall at Hyak would be far less than at Snoqualmie Pass and the numbers in the data. Given the sharp decline in snowfall in that region both with decreasing elevation and increasing distance east of the Cascade Crest, although Hyak is only 2.5 miles east of the Crest, at 2600 ft it's likely to have at least 20-30% less snowfall than Snoqualmie Pass.
So what about the snowfall this year: obviously a freakish anomaly of the highest order, especially so at Snoqualmie Pass. With 1" of new snowfall recorded today (the first snowfall there in the entire month of March!?!), the total now stands at 81". How likely is significant additional snowfall? Current forecasts for the next week pretty much rule out additional snowfall this month at Snoqualmie, although heavy precip is certain for tomorrow, along with significant snowfall at higher elevations, and there may be a couple more systems on Friday and Monday which bring snow higher up. So on to April and May:
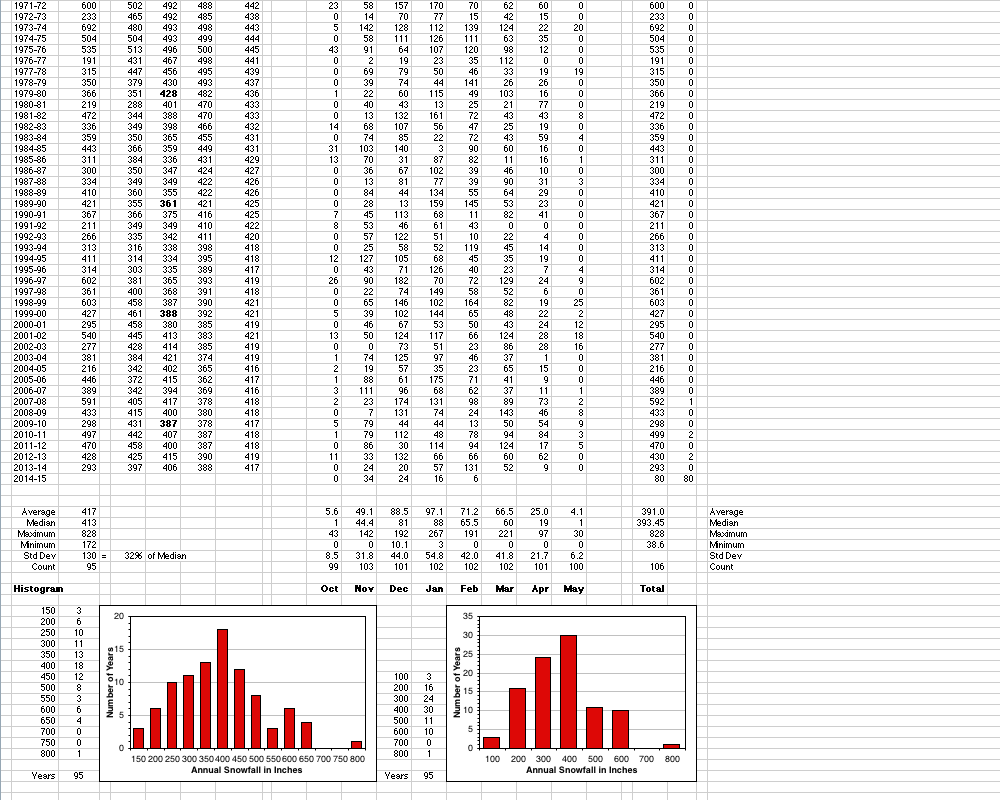
Average snowfall at Snoqualmie Pass in April and May is about 30" as shown in the data, but median snowfall is only 20" with a standard deviation of almost 30". The maximum April-May snowfall is 97" (in April 1955, followed by 0" that May), while the minimum April-May snowfall is 0" in several years. Which is to say, spring snowfall at Snoqualmie Pass is extremely fickle and variable, and quite likely to end up under 20". Since the median is 20", statistically there is only about a 50% chance of Snoqualmie breaking 100" this season. Given the lack of any indication from climate models of a cooler and wetter than normal April this year, the real chance is probably well under 50% at this point. And the likelihood of this year matching the previous record low of 172" is minuscule, statistically on the order of 1%, and realistically well under that.
Assuming it does end up under 100", how unusual, how statistically unlikely would such a total be? The previous record low in a complete season was 172" in 1941-42, trailed closely by 196" in 1940-41 and 191" in 1976-77. So a sub-100" snowfall would be a very extreme outlier at roughly half the previous low. Given the median snowfall of 413" over the full period of record with a standard deviation of 130", a total of 90" would be about 2.5 standard deviations below the median, which is in the 0.6 percentile, or roughly 1 in 160 years!!
That's all based on a normal distribution though, and annual snowfall totals are not "normally" distributed, but it's good enough for a rough approximation of how unlikely a sub-100" snowfall total would be. To verify that, let's see how many years fall under 220", which is 1.5 standard deviations below the median, or 6.7 percentile, roughly 1 in 15 years. Out of the 95 complete years, 6 of them are under 220", which matches the statistical expectation well. So this calculation method seems reasonable despite the snowfall totals not being normally distributed. And given that there are nearly 100 years of data, it's quite reasonable to encounter a 1 in 160 year event in such a data set.
Replied by Amar Andalkar on topic Re: WSDOT - Only 80" of Snow at Snoq Pass this Winter
Interesting to see the yearly average steadily drop.
It is interesting to see the steady decline at this particular location.
Come on folks, it's well known by now that this is a completely artificial effect, which occurs because that set of data is cut-off at 1950. So it accidentally starts with a bunch of huge snowfall years during the fattest part of the Pacific Decadal Oscillation (PDO) cycle, and leaves out a bunch of terrible low-snowfall years right before 1950. Extending the data set back as far as it exists makes this artificial effect vanish. Here is a plot of all available snowfall data at Snoqualmie Pass back to 1910, with several running averages superimposed:
Clearly the full cumulative average (red line) shows no such steady decline! It trends downward throughout the 1920s, increases a bit in the 1930s, decreases sharply again in the 1940s, then increases over the next 25 years through the mid 1970s, then decreases again until the mid 1990s, and finally holds almost steady for the last 2 decades, with increases in big years offset by decreases in other years (the cumulative average is 417" as of 1996 and still 417" after 2014).
The other long-term running averages over 10 and 30 year periods also show no such decline. If you look at the average snowfall in each calendar decade, it is also clear that no steady decline has occurred:
[tt]
1910-1920 450"
1920-1930 356"
1930-1940 419"
1940-1950 343"
1950-1960 545"
1960-1970 474"
1970-1980 428"
1980-1990 361"
1990-2000 388"
2000-2010 387"
[/tt]
Regarding the 10 missing years that are not shown in the plot: most of those years are missing only 1 or 2 months of data during the crucial November-April period when about 98% of the annual snowfall at this location occurs. However, it seems best not to include such years in order to avoid skewing the averages. Of the 10 years not shown on the graph, 4 of them are actually really bad snow years, even assuming normal or heavy snowfall during the 1-2 missing months (1914-15, 1925-26, 1944-45, and 1945-46), while only 2 are near-normal (1911-12 and 1916-17) and the other 4 of them are missing most of the data for the entire season (1909-10, 1919-20, 1928-29, 1929-30). Therefore including the 6 near-complete years would only further reinforce what the plot already shows, that snowfall was far less than the long-term average during the 1920s and 1940s.
The older Snoqualmie Pass data is available from the Western Regional Climate Center at www.wrcc.dri.edu/cgi-bin/cliMONtsnf.pl?wa7781 . There are slight discrepancies from the WSDOT data during the period that they overlap, but in general it's a pretty good match within a few %, as good as can be expected in such snowfall data. Note that the listed annual totals in the original WRCC data have a major flaw: when any month is missing more than 5 days, they don't count it at all in annual totals, which undercounts the totals severely in many years. Although it is proper to leave out partial months when calculating monthly averages, it is erroneous to leave out partial months in sums such as annual totals for cumulative quantities like snowfall or precip, since leaving those out makes the listed annual totals more wrong than including them does. I'm not sure how WRCC could make such a significant mathematical blunder in all of their data for all sites, but it's been like that for as long as I've been looking at the WRCC data (over 10 years).
So my listed annual totals do include such partial months, although if too much is missing in any year especially in the important big-snowfall months, I leave the annual total blank as mentioned above. But I have not yet gone through the original daily snowfall records for Snoqualmie Pass from the National Climatic Data Center in order to manually clean up any other errors that might be found in the older data (I usually do this at some point for most sites that I track snowfall data for, but it's a big pain).
For those who wish to see the complete Snoqualmie Pass data set, for pure interest and also to verify that no chicanery or manipulation occurred in the graph above, here it is as a screen capture from my original spreadsheet (I'd prefer not to post the original Excel spreadsheet online):
Note that all of this data (WSDOT and WRCC and TomK's data shown in a previous post) is from the summit of Snoqualmie Pass near 3000 ft (3010 or 3020 ft), none of it is from Hyak (2600 ft) despite what various files online may say. The confusion may arise because WSDOT has a maintenance / operations center at Hyak. However, snowfall at Hyak would be far less than at Snoqualmie Pass and the numbers in the data. Given the sharp decline in snowfall in that region both with decreasing elevation and increasing distance east of the Cascade Crest, although Hyak is only 2.5 miles east of the Crest, at 2600 ft it's likely to have at least 20-30% less snowfall than Snoqualmie Pass.
So what about the snowfall this year: obviously a freakish anomaly of the highest order, especially so at Snoqualmie Pass. With 1" of new snowfall recorded today (the first snowfall there in the entire month of March!?!), the total now stands at 81". How likely is significant additional snowfall? Current forecasts for the next week pretty much rule out additional snowfall this month at Snoqualmie, although heavy precip is certain for tomorrow, along with significant snowfall at higher elevations, and there may be a couple more systems on Friday and Monday which bring snow higher up. So on to April and May:
Average snowfall at Snoqualmie Pass in April and May is about 30" as shown in the data, but median snowfall is only 20" with a standard deviation of almost 30". The maximum April-May snowfall is 97" (in April 1955, followed by 0" that May), while the minimum April-May snowfall is 0" in several years. Which is to say, spring snowfall at Snoqualmie Pass is extremely fickle and variable, and quite likely to end up under 20". Since the median is 20", statistically there is only about a 50% chance of Snoqualmie breaking 100" this season. Given the lack of any indication from climate models of a cooler and wetter than normal April this year, the real chance is probably well under 50% at this point. And the likelihood of this year matching the previous record low of 172" is minuscule, statistically on the order of 1%, and realistically well under that.
Assuming it does end up under 100", how unusual, how statistically unlikely would such a total be? The previous record low in a complete season was 172" in 1941-42, trailed closely by 196" in 1940-41 and 191" in 1976-77. So a sub-100" snowfall would be a very extreme outlier at roughly half the previous low. Given the median snowfall of 413" over the full period of record with a standard deviation of 130", a total of 90" would be about 2.5 standard deviations below the median, which is in the 0.6 percentile, or roughly 1 in 160 years!!
That's all based on a normal distribution though, and annual snowfall totals are not "normally" distributed, but it's good enough for a rough approximation of how unlikely a sub-100" snowfall total would be. To verify that, let's see how many years fall under 220", which is 1.5 standard deviations below the median, or 6.7 percentile, roughly 1 in 15 years. Out of the 95 complete years, 6 of them are under 220", which matches the statistical expectation well. So this calculation method seems reasonable despite the snowfall totals not being normally distributed. And given that there are nearly 100 years of data, it's quite reasonable to encounter a 1 in 160 year event in such a data set.
Please Log in or Create an account to join the conversation.
- Norseman
-
- User
-
Less
More
- Posts: 55
- Thank you received: 0
11 years 4 months ago - 11 years 4 months ago #224286
by Norseman
Replied by Norseman on topic Re: WSDOT - Only 80" of Snow at Snoq Pass this Winter
Hmm... internet trolling really does work! I thought for sure you'd merely point back to
your old thread of epic analytics
in order to set straight a dumb statement about statistical snowfall.
Is teasing allowed here?
Anyway... mostly relevant to the above delving: Cliff Mass: Why has the weather been so unusual the past two winters?
Is teasing allowed here?
Anyway... mostly relevant to the above delving: Cliff Mass: Why has the weather been so unusual the past two winters?
Please Log in or Create an account to join the conversation.
- Pete_H
-
- User
-
Less
More
- Posts: 140
- Thank you received: 0
11 years 4 months ago #224287
by Pete_H
Replied by Pete_H on topic Re: WSDOT - Only 80" of Snow at Snoq Pass this Winter
Unfortunately the blob has taken a liking to the west coast. Thing needs to be convinced Detroit or somewhere else is just as nice...
Please Log in or Create an account to join the conversation.
- Stefan
-
- User
-
Less
More
- Posts: 102
- Thank you received: 2
11 years 4 months ago #224289
by Stefan
Replied by Stefan on topic Re: WSDOT - Only 80" of Snow at Snoq Pass this Winter
Amar,
So what has been the overall trend of snow since 1950 at Snoqualmie Pass?
I understand you want to take every year's worth of data. Understandable. You are also taking a set data limit based on the information available. What about what happened in the 1700's and 1800's. What if the periods in the 1940-1970's were anomolies compared to the long term trends in the 1700's and 1800's? We don't know that information. Not trying to start a flame war here, but I know very little about statistics.
My only question is, what has been the overall trend of snow since 1950 at Snoqualmie Pass. I think it is fairly narrow question. And yes it is a limited question. Does it answer all the questions? No. It my opinion, it would answer a short term question for snow at Snoqualmie Pass. In my opinion it would not answer a long term question for snow at Snoqualmie Pass.
Please Log in or Create an account to join the conversation.