- Posts: 140
- Thank you received: 0
WSDOT - Only 80" of Snow at Snoq Pass this Winter
- Pete_H
-

- User
-

Less
More
11 years 4 months ago #224292
by Pete_H
Replied by Pete_H on topic Re: WSDOT - Only 80" of Snow at Snoq Pass this Winter
I hear the skiing at Snoqualmie was just sick during the Pleistocene Epoch.
Please Log in or Create an account to join the conversation.
- Amar Andalkar
-
- User
-
Less
More
- Posts: 635
- Thank you received: 0
11 years 4 months ago - 11 years 4 months ago #224294
by Amar Andalkar
The key issue is that your question is simply not a well-posed question for snow climatology in the Pacific Northwest: although it has an obvious answer, that answer is deceptive due to an inappropriate choice of starting point. It obscures the real trends, the real answers and insight into the behavior of the data that one is actually seeking. Because 1950 is the start of a period which is such an extreme positive relative to the overall longer-term averages, it just can't be the starting point for any fair and balanced snow climatology study in the Pacific Northwest, assuming one is actually looking for real answers, and not just trying to deceive oneself or the public and maybe push some sort of agenda (as several notoriously flawed studies have done).
Regarding statistics: Any cumulative average of any time-series data set which is cut off so that it starts with several values well-above the overall average will automatically have a downward trend, but that downward trend actually contains little or no useful information, since it primarily reflects the arbitrary choice of starting point. Cumulative averages are therefore always severely flawed because of this over-sensitivity to starting point. They really perhaps shouldn't be used at all, but it's a standard practice to calculate them.
Much better are running averages (such as the 5, 10, and 30 year averages shown on my plot above), which avoid that starting point issue, although they still have other artifacts. The cumulative average has been entirely downward for the data set cut-off to start in 1950 (showing a "steady decline"), but the running averages show that this has not been so at all, and reveal that snowfall in the past 2 decades has actually increased substantially over the previous 2 decades.
Fitted linear trend lines also have a similar false-impression issue to the cumulative average, although they do at least consider the entire data set at once unlike the cumulative average. When they start with several values well-above the overall average, they tend to artificially make things look like a "steady decline" when in fact the reality may be much more complicated, with substantial increases over various periods.
Overall, it's just far better to try to pick a "fair" starting point which better reflects the entire available data set. It is intuitively obvious by glancing at the Snoqualmie data (or the data for any other mountain site in the Pacific Northwest which extends back well past 1950) that 1910 or 1920 or 1930 are all MUCH better choices for a starting point than 1950. All the stuff about 1700s or 1800s is irrelevant, as no weather records exist in this part of the world. Although numerous studies have been done that far back and even farther, using various proxies for weather data such as dendrochronology (tree ring analysis), that's not even close to the same thing as actual real data. Since we do have good snowfall and snowpack data which extends back for about 100 years at a number of sites, we should use the entire data sets and not arbitrarily cut off at 1950 or any other year, with the caveat that if data quality is known to be worse prior to some date, then that could also set a reasonable starting point.
Did you ask Silas how it was??
Replied by Amar Andalkar on topic Re: WSDOT - Only 80" of Snow at Snoq Pass this Winter
So what has been the overall trend of snow since 1950 at Snoqualmie Pass?
I understand you want to take every year's worth of data. Understandable. You are also taking a set data limit based on the information available. What about what happened in the 1700's and 1800's. What if the periods in the 1940-1970's were anomolies compared to the long term trends in the 1700's and 1800's? We don't know that information. Not trying to start a flame war here, but I know very little about statistics.
My only question is, what has been the overall trend of snow since 1950 at Snoqualmie Pass. I think it is fairly narrow question. And yes it is a limited question. Does it answer all the questions? No. It my opinion, it would answer a short term question for snow at Snoqualmie Pass. In my opinion it would not answer a long term question for snow at Snoqualmie Pass.
The key issue is that your question is simply not a well-posed question for snow climatology in the Pacific Northwest: although it has an obvious answer, that answer is deceptive due to an inappropriate choice of starting point. It obscures the real trends, the real answers and insight into the behavior of the data that one is actually seeking. Because 1950 is the start of a period which is such an extreme positive relative to the overall longer-term averages, it just can't be the starting point for any fair and balanced snow climatology study in the Pacific Northwest, assuming one is actually looking for real answers, and not just trying to deceive oneself or the public and maybe push some sort of agenda (as several notoriously flawed studies have done).
Regarding statistics: Any cumulative average of any time-series data set which is cut off so that it starts with several values well-above the overall average will automatically have a downward trend, but that downward trend actually contains little or no useful information, since it primarily reflects the arbitrary choice of starting point. Cumulative averages are therefore always severely flawed because of this over-sensitivity to starting point. They really perhaps shouldn't be used at all, but it's a standard practice to calculate them.
Much better are running averages (such as the 5, 10, and 30 year averages shown on my plot above), which avoid that starting point issue, although they still have other artifacts. The cumulative average has been entirely downward for the data set cut-off to start in 1950 (showing a "steady decline"), but the running averages show that this has not been so at all, and reveal that snowfall in the past 2 decades has actually increased substantially over the previous 2 decades.
Fitted linear trend lines also have a similar false-impression issue to the cumulative average, although they do at least consider the entire data set at once unlike the cumulative average. When they start with several values well-above the overall average, they tend to artificially make things look like a "steady decline" when in fact the reality may be much more complicated, with substantial increases over various periods.
Overall, it's just far better to try to pick a "fair" starting point which better reflects the entire available data set. It is intuitively obvious by glancing at the Snoqualmie data (or the data for any other mountain site in the Pacific Northwest which extends back well past 1950) that 1910 or 1920 or 1930 are all MUCH better choices for a starting point than 1950. All the stuff about 1700s or 1800s is irrelevant, as no weather records exist in this part of the world. Although numerous studies have been done that far back and even farther, using various proxies for weather data such as dendrochronology (tree ring analysis), that's not even close to the same thing as actual real data. Since we do have good snowfall and snowpack data which extends back for about 100 years at a number of sites, we should use the entire data sets and not arbitrarily cut off at 1950 or any other year, with the caveat that if data quality is known to be worse prior to some date, then that could also set a reasonable starting point.
I hear the skiing at Snoqualmie was just sick during the Pleistocene Epoch.
Did you ask Silas how it was??
Please Log in or Create an account to join the conversation.
- MattT
-
- User
-
Less
More
- Posts: 62
- Thank you received: 0
11 years 4 months ago #224293
by MattT
So if annual snowfall doesn't fit a normal distribution (which I imagine has something to do with extreme high and low events not having the same probabilities, as well as low events being limited by 0, and high events technically not limited), what type of fit is more appropriate?
In the end, it probably doesn't matter much anyway. After busting out my old hydrology text books and doing some quick napkin math with other distributions, this year would be anywhere from a 1 in 150 year event, to a 1 in 170ish year event. So, we won't have another year this bad for 150+ years, right?!
Replied by MattT on topic Re: WSDOT - Only 80" of Snow at Snoq Pass this Winter
That's all based on a normal distribution though, and annual snowfall totals are not "normally" distributed, but it's good enough for a rough approximation of how unlikely a sub-100" snowfall total would be.
So if annual snowfall doesn't fit a normal distribution (which I imagine has something to do with extreme high and low events not having the same probabilities, as well as low events being limited by 0, and high events technically not limited), what type of fit is more appropriate?
In the end, it probably doesn't matter much anyway. After busting out my old hydrology text books and doing some quick napkin math with other distributions, this year would be anywhere from a 1 in 150 year event, to a 1 in 170ish year event. So, we won't have another year this bad for 150+ years, right?!
Please Log in or Create an account to join the conversation.
- Amar Andalkar
-
- User
-
Less
More
- Posts: 635
- Thank you received: 0
11 years 4 months ago - 11 years 4 months ago #224298
by Amar Andalkar
Yeah, those are the main issues with the distribution deviating from normal.
It's actually not that bad to assume a normal distribution for annual snowfall at high-snowfall sites which are always reliably far above zero in every year (including Snoqualmie Pass, even this year!). It's also reasonably valid for April 1 snowdepth at most high-snowfall sites, as long as the snowdepth is always reliably far above zero in every year (not really the case at Snoqualmie Pass in any number of bad years). I don't know of any other distribution which fits better, and the calculational advantages of assuming a normal distribution are significant, while the flaws are unimportant for this type of rough calculation.
However, as annual snowfall decreases and variability increases, the normal distribution quickly becomes useless. One easy and instructive way to see this is to look at histograms of the annual snowfall versus histograms of the snowfall in a given month. Here it is for Snoqualmie Pass for annual, January, March, and April snowfall:
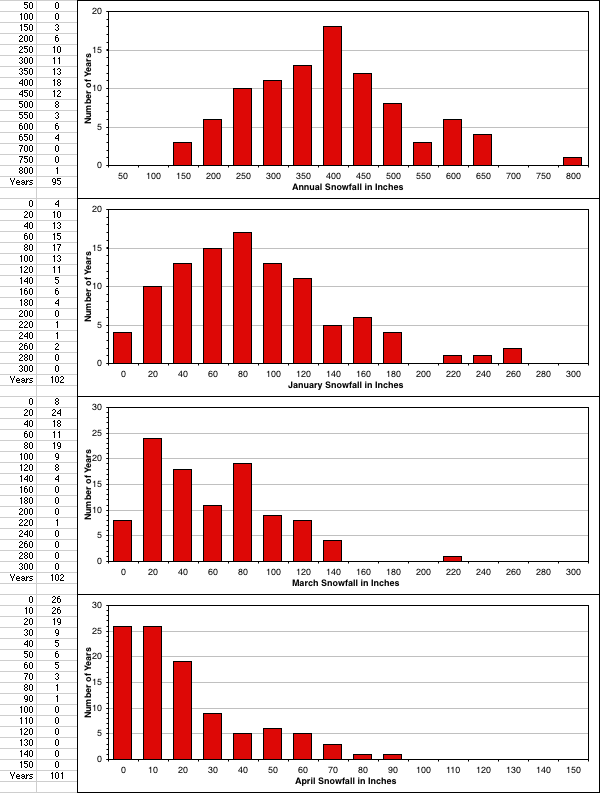
So the annual snowfall is a reasonable match to a normal distribution, as much as one could expect in this type of data. But January, the highest snowfall month there (average snowfall 97", median 88", standard deviation 55"), is showing a significant departure from normal as it runs too close to zero in a number of years and has a larger-than-expected number of high outliers, although it still has the basic normal shape.
Not so for March (average snowfall 67", median 60", standard deviation 42") or April (average snowfall 25", median 19", standard deviation 22"), which both clearly look nothing like a normal distribution. March is affected by very large scatter (manifesting itself as 2 peaks) and running close to zero in several years, while April is pretty much quashed up against zero in a large fraction of the years.
Replied by Amar Andalkar on topic Re: WSDOT - Only 80" of Snow at Snoq Pass this Winter
So if annual snowfall doesn't fit a normal distribution (which I imagine has something to do with extreme high and low events not having the same probabilities, as well as low events being limited by 0, and high events technically not limited), what type of fit is more appropriate?
Yeah, those are the main issues with the distribution deviating from normal.
It's actually not that bad to assume a normal distribution for annual snowfall at high-snowfall sites which are always reliably far above zero in every year (including Snoqualmie Pass, even this year!). It's also reasonably valid for April 1 snowdepth at most high-snowfall sites, as long as the snowdepth is always reliably far above zero in every year (not really the case at Snoqualmie Pass in any number of bad years). I don't know of any other distribution which fits better, and the calculational advantages of assuming a normal distribution are significant, while the flaws are unimportant for this type of rough calculation.
However, as annual snowfall decreases and variability increases, the normal distribution quickly becomes useless. One easy and instructive way to see this is to look at histograms of the annual snowfall versus histograms of the snowfall in a given month. Here it is for Snoqualmie Pass for annual, January, March, and April snowfall:
So the annual snowfall is a reasonable match to a normal distribution, as much as one could expect in this type of data. But January, the highest snowfall month there (average snowfall 97", median 88", standard deviation 55"), is showing a significant departure from normal as it runs too close to zero in a number of years and has a larger-than-expected number of high outliers, although it still has the basic normal shape.
Not so for March (average snowfall 67", median 60", standard deviation 42") or April (average snowfall 25", median 19", standard deviation 22"), which both clearly look nothing like a normal distribution. March is affected by very large scatter (manifesting itself as 2 peaks) and running close to zero in several years, while April is pretty much quashed up against zero in a large fraction of the years.
Please Log in or Create an account to join the conversation.
- kamtron
-
- User
-
Less
More
- Posts: 273
- Thank you received: 8
11 years 4 months ago #224301
by kamtron
Replied by kamtron on topic Re: WSDOT - Only 80" of Snow at Snoq Pass this Winter
Gamma distribution!
Please Log in or Create an account to join the conversation.
- T. Eastman
-
- User
-
Less
More
- Posts: 288
- Thank you received: 0
11 years 4 months ago #224303
by T. Eastman
Replied by T. Eastman on topic Re: WSDOT - Only 80" of Snow at Snoq Pass this Winter
Is the data making you a better skier?
Please Log in or Create an account to join the conversation.