- Posts: 23
- Thank you received: 0
Has low-elevation Cascade snowpack been declining?
- Floater
-

- User
-

Less
More
11 years 6 months ago #223603
by Floater
Replied by Floater on topic Re: Has low-elevation Cascade snowpack been declining?
I have to admit that my perceptions are biased by starting to ski seriously in the early 1960s (Yes I skied here in the 1950s as well as a young kid, ouch). I remember going on the ski bus to Stevens and in some of those amazing years looking at Skykomish and seeing the town buried in snow. Then one year around 1968 I can remember seeing North Bend (main highway went right through town) buried in snow on the way up to the Pass or going through Greenwater and seeing tons of snow there on the way to Crystal.
This gave me a distorted view of snowpacks in the Northwest. It also shows my age. I am just way too old. Yes I skied the Golden Years and yes we used Look Nevada bindings and Head metal skis with long thongs and double leather boots and stretch pants. Yep 200 cm either Head Standards, Masters or Comps. I can remember skiing down to Tunnel Creek from 7th as well and catching a ride at the hairpin back up to the pass and in those days we never carried beacons or for that matter a pack. We did ask the ski patrol and pick and choose our days but I can remember skiing back there and seeing some big nasty slides. Sometimes the patrol would ski along with you. Damn lucky to still be skiing is all I can say.
This gave me a distorted view of snowpacks in the Northwest. It also shows my age. I am just way too old. Yes I skied the Golden Years and yes we used Look Nevada bindings and Head metal skis with long thongs and double leather boots and stretch pants. Yep 200 cm either Head Standards, Masters or Comps. I can remember skiing down to Tunnel Creek from 7th as well and catching a ride at the hairpin back up to the pass and in those days we never carried beacons or for that matter a pack. We did ask the ski patrol and pick and choose our days but I can remember skiing back there and seeing some big nasty slides. Sometimes the patrol would ski along with you. Damn lucky to still be skiing is all I can say.
Please Log in or Create an account to join the conversation.
- Amar Andalkar
-
Topic Author
- User
-
Less
More
- Posts: 635
- Thank you received: 0
11 years 6 months ago - 11 years 6 months ago #223604
by Amar Andalkar
Replied by Amar Andalkar on topic Re: Has low-elevation Cascade snowpack been declining?
Well, the answer to this thread's title seems clear beyond a reasonable doubt at least in Washington, based on all the data in the posts above -- but what about Oregon? After pondering and analyzing and writing about this subject so much for the past 2 weeks, it seems natural to take a look at our southern neighbor while all this work is still fresh in my mind.
[hr]Has the low-elevation snowpack in the Oregon Cascades been declining over the past 2-3 decades??
First of all, let's review the snow climatology of the Oregon Cascades as essential background before looking at the data:
The 250-mile north-south extent of the Oregon Cascades forms a transition zone between two very different climatic regimes, a smooth gradient connecting the cooler and wetter "Pacific Northwet" climate zone (which extends from Washington north through coastal BC and into southeast Alaska) with the warmer and sunnier Mediterranean-type climate zone which covers much of California. Snowfall and snowpack in the Pacific Northwest zone has very strong positive correlations to the cool phase of both the ENSO (La Nina) and PDO cycles as discussed above in the first post, while in California the snowfall and snowpack (and precip) has very strong positive correlations to the warm phase of the ENSO cycle (El Nino), but has uncertain correlations to PDO (probably not well correlated, but I'm not sure if this has been studied much at all).
The northern Oregon Cascades (the northern 1/3 from the Columbia Gorge past Mount Hood south to Mount Jefferson and Santiam Pass) are very similar climatologically to the southern Washington Cascades (which extend from just south of Snoqualmie Pass to the Columbia Gorge including Mounts Rainier, Adams, and Saint Helens). Also similarly, the east side of the northern Oregon Cascades features a substantial deep basin (the Columbia Basin) with elevations of typically 1000-2000 ft, just like the east side of the southern and central Washington Cascades.
The southern Oregon Cascades (the southern 1/3 from the Klamath River at the California border, north past Mount McLoughlin, Crater Lake, and Mount Thielsen) are fairly similar climatologically to the California Cascades (which extend from the Klamath River south through Mount Shasta and Lassen Peak to the northern edge of the Sierra Nevada at Lake Almanor and the North Fork Feather River). The southern Oregon Cascades are much drier and sunnier than the northern Oregon Cascades, and the southernmost part (from about Mount McLoughlin south) is substantially rain-shadowed by the 7000+ ft peaks of the Siskiyou Mountains to their west and southwest.
In between south and north, the central Oregon Cascades (from Santiam Pass through the Three Sisters group south to Diamond Peak) form the heart of the climatic transition zone. The east side of both the central and southern Oregon Cascades features a substantial high plateau (the High Desert) ranging from about 3000-5000 ft, very similar to the California Cascades (with the Modoc Plateau to their east) in that regard.
Just as in Washington, a very sharp east-west climatic separation also occurs along the crest of the Oregon Cascades, with generous annual precip of up to 100-140" along the wet west slopes (highest in the northern part) and a rain-shadowed semi-desert with meager annual precip of barely 10-20" along the dry east slopes and the adjacent High Desert plateau. The west side of both the southern and central Oregon Cascades (and extending partway along the northern Oregon Cascades) also includes a substantial region of lower, older foothills known as the Western Cascades, which extend far west of the crest.
Based on these known climatological factors, we can try to guess what to expect when we look at the data here. For the northern Oregon Cascades, we should expect to find results similar to those of Washington, with near-normal snowpacks in recent years and strong correlation to the PDO cycle. For the southern Oregon Cascades, the situation is likely to be somewhat different, as the effects of the current historically-unprecedented California drought (already 3 full years, and very possibly heading into a fourth) have definitely now extended north into this region. As for the central Oregon Cascades, it's hard to say which way it might lean (closer to northern or southern) during the recent time period or what its historic trends might look like. Let's analyze some relevant data and try to find out.
What low-elevation snow data exists for Oregon?
Once again, we need to define "low-elevation" in this case. Using a similar methodology to Washington, the lower limit of useful snow data is about 2000-2500 ft in the north and 3000-3500 ft in the south, as extreme random variation dominates the snow data at sites below that level. The top of the low-elevation band extends up to about 4500 ft, which includes the lowest passes across the Cascade Crest in Oregon (all between Mount Hood and Olallie Butte, including Barlow Pass, Wapinitia Pass, Abbot Pass, etc.) while excluding all other Cascade Crest passes farther south through the California border. Therefore we'll consider data from about 2500-4500 ft as low-elevation for snowfall and snowpack data in Oregon, while 4500-6500 ft would be considered mid-elevation, and 6500-8000 ft are the highest elevations at which such data is available. Just as in Washington (where each band is about 1000 ft lower), the mid-elevation band contains the overwhelming majority of snowpack measurement sites, with far fewer in the low or especially the high elevation ranges.
At low elevations of 2500-4500 ft that we are considering, and even looking for data that only extends back at least 35-40 years, there are barely a handful of sites in the Oregon Cascades with reasonably complete snowfall and snowdepth data over that period (if there are any other such sites, I have not found them thus far). Thankfully, through pure chance these 5 sites are nicely distributed over the entire length of the Oregon Cascades:
[tt]
Government Camp 3980 ft 45.30 -121.74 on the south side of Mount Hood
Marion Forks Fish Hatchery 2480 ft 44.61 -121.95 west of Mount Jefferson
Wickiup Dam 4360 ft 43.68 -121.69 south of Mount Bachelor
Lemolo Lake 3 NNW 4080 ft 43.36 -122.22 near Diamond Lake
Howard Prairie Dam 4570 ft 42.23 -122.38 south of Mount McLoughlin
[/tt]
Here are plots of the snowfall data at these 5 sites with several running averages superimposed (data from WRCC and NCDC ):
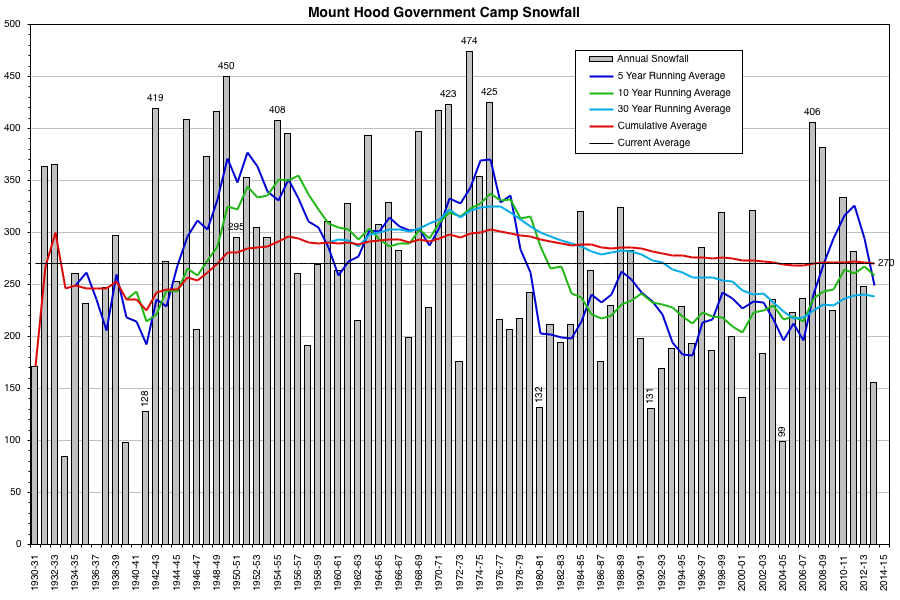
Government Camp (3980 ft) is located on the southern flanks of Mount Hood, about 6 miles SSW of the summit and 3 miles west of the Cascade Crest (which goes up the south side of Hood just west of the White River drainage). It has an average annual precip of 88" to produce its 270" average annual snowfall, which is less than half the average annual snowfall of over 550" with 110" of precip recorded at Timberline Lodge (5900 ft), about halfway from Govy to the summit. Government Camp has one of the longest historical climate records of any mountain location in the entire Cascade Range, with weather records including snowfall and snowdepth extending back to 1895. The current Government Camp site has data back to 1951, while prior to that from 1895-1951 the records are listed under "Summit Guard Station" with the same coordinates and an elevation of 3900 ft, so the snowfall may not have been recorded at the same exact location. Note that prior to 1941, the annual snowfall totals shown above only include data from November through March, so the annual snowfall is being under-reported by roughly 10-15% on average due to missing April (which averages about 26" for the month) and October and May (which each average about 6"). I considered leaving those years out of the plot, but decided to include them with that disclaimer.
Overall, the snowfall data for Government Camp looks very similar to that from Longmire (to which it appears to be quite well-correlated) and Snoqualmie Pass in the Washington Cascades, with recent years generally having above-normal snowfall following a low period from 1977-1996, which was preceded by well above-normal snowfall from the mid-1940s through 1976. Just as expected from the basic climatology of the northern Oregon Cascades discussed above.
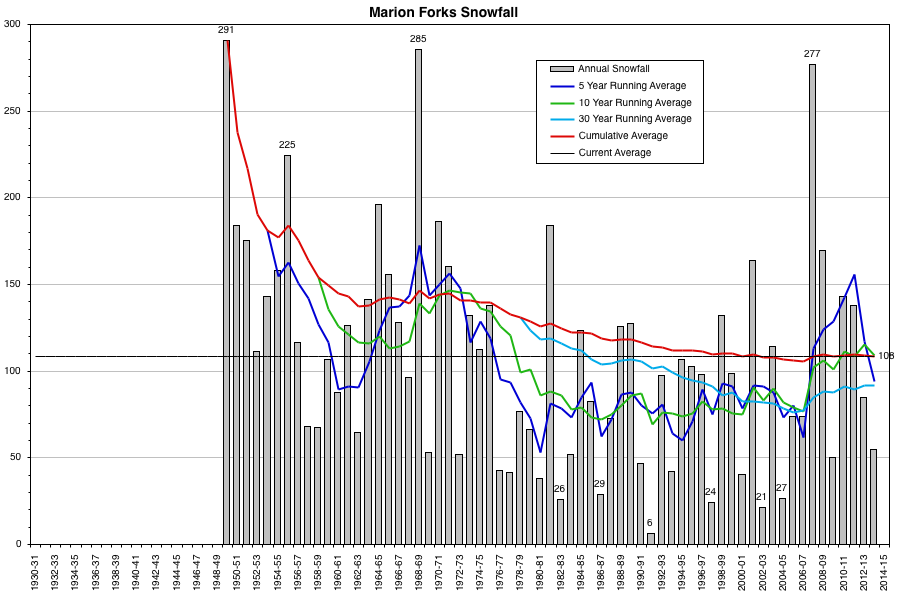
The Marion Forks Fish Hatchery (2480 ft) is located on the floor of a large glacial trough which extends down from Marion Lake into the North Santiam River valley, about 8 miles WSW of the summit of Mount Jefferson and 7 miles west of the Cascade Crest. It has an average annual precip of 70" to produce its 110" average annual snowfall, but its very low elevation results in extreme variability in the snowfall numbers, with annual totals spanning an almost unbelievable range from nearly 300" in the biggest years to only 6" in the record low year, a factor of almost 50 from highest to lowest! Despite that variability, the long-term pattern is fairly similar to that of Government Camp and the Washington Cascades, with the past 9 years being much better than 1977-2005, and a period of generally larger snowfalls before that.
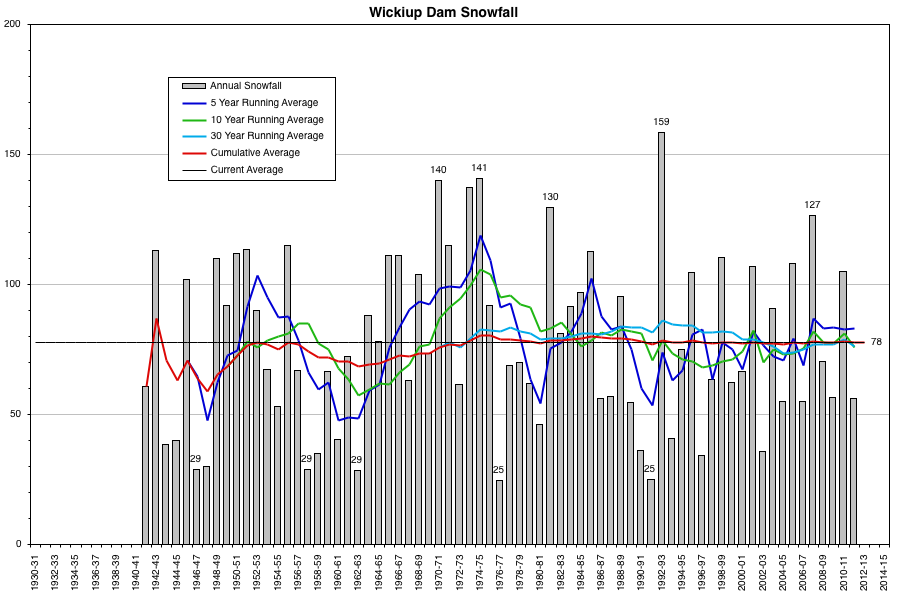
Wickiup Dam (4360 ft) is located well out on the dry eastern flank of the central Oregon Cascades, about 14 miles east of Maiden Peak on the Cascade Crest near Willamette Pass and 20 miles south of Mount Bachelor. With an average annual precip of only 20" to produce its almost 80" average annual snowfall, this is clearly in a very different climate than either of the preceding 2 sites. The pattern of snowfall years reflects this difference, as it looks nothing like those 2 sites or any of the 5 sites graphed in Washington. Quite interestingly, it shows almost no long-term trends at all, with its large annual variations superimposed on a nearly flat long-term average, perhaps even with a very slight upward trend if at all. Unfortunately, data for the past 2 years is very spotty and largely missing, so it is unclear if the high-quality snow data from this site will continue or not.
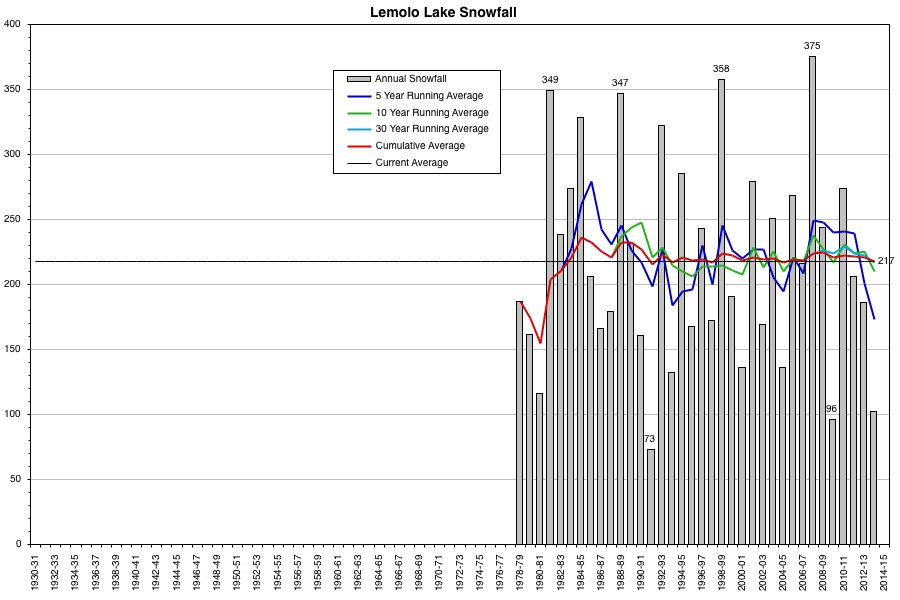
The Lemolo Lake 3 NNW site (4080 ft) is located 3 miles NW of Lemolo Lake, about 9 miles west of Windigo Pass on the Cascade Crest, about 12 miles SSW of Diamond Peak and 12 miles NNW of Diamond Lake. Although only about 35 miles SW of Wickiup Dam, it is in a much wetter climate on the west side of the range, with an average annual precip of 65" to produce its almost 220" average annual snowfall. Over its fairly short 36-year period of record, this site also shows almost no long-term trends at all, although the past 3 seasons have all been below normal due to the effects of the California drought extending north into this part of the southern Oregon Cascades.
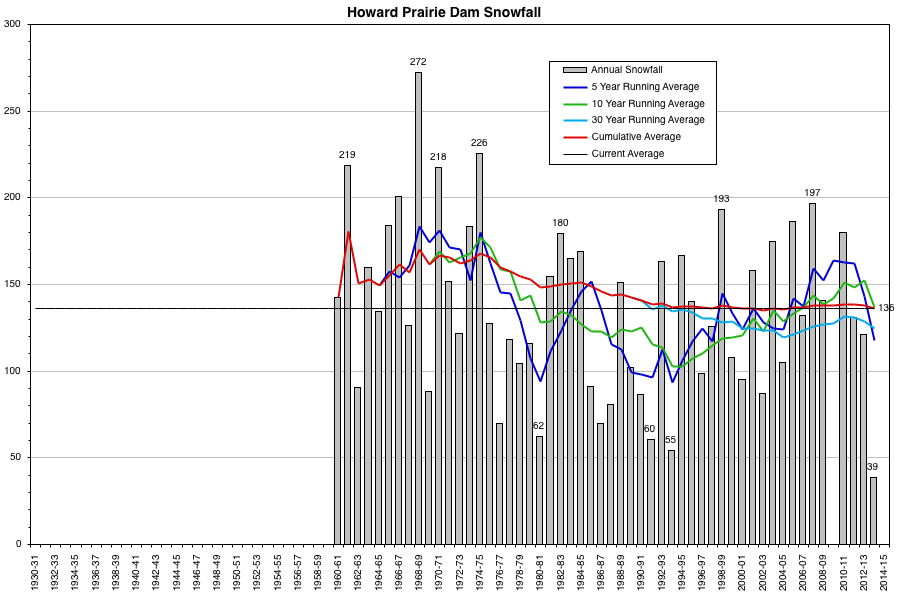
Howard Prairie Dam (4570 ft) is located about 15 miles SSW of Mount McLoughlin and 15 miles north of the California border, about 9 miles west of the Cascade Crest. Despite being west of the Crest, due to rain-shadowing from the 7000+ ft peaks of the Siskiyou Mountains to the west and southwest, this is a much drier climate than areas farther north like Lemolo Lake, with an average annual precip of 32" to produce its almost 140" average annual snowfall. Although a strong downward long-term trend is not clear, there are definitely more medium-term ups and downs than either of the previous 2 sites, and once again the past 3 seasons have all been below normal due to the effects of the California drought, with 2013-14 sadly posting the all-time record low snowfall at this site over its 50+ year period of record.
For an interesting comparison with the low-elevation sites, here is the data from a much higher elevation site at Crater Lake over the same time period (this plot added on 22Jan2015):
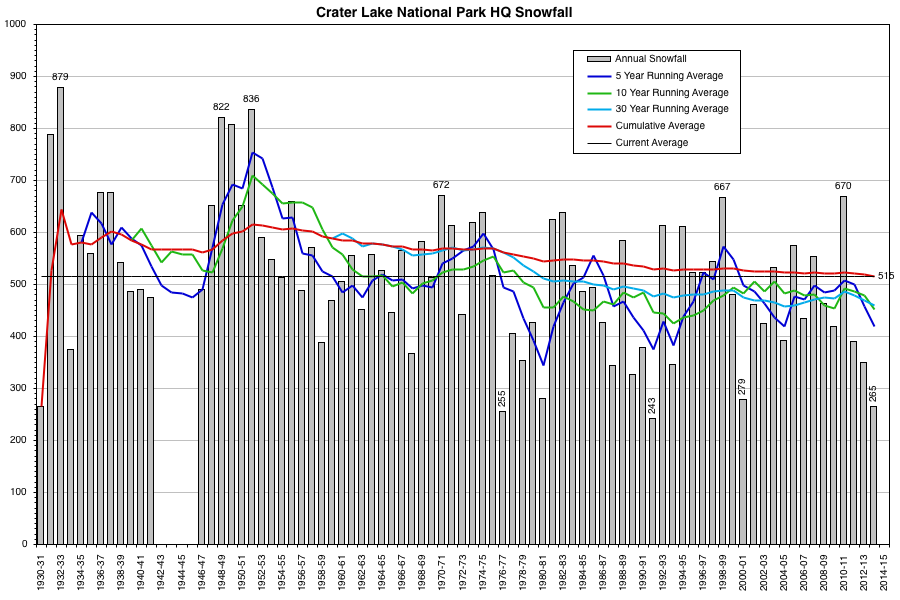
As mentioned in the original post above, Crater Lake National Park Headquarters (6470 ft) in southern Oregon is one of only 2 mid-high elevation sites in the entire Cascade Range with snowfall and snowdepth data extending back for over 90 years. It is far snowier than any other site in southern Oregon, with an average annual precip of 65" to produce its 515" average annual snowfall. The data from Crater Lake clearly shows more of an overall downward trend in snowfall over the entire period back to 1930 than any of the low elevation sites in Washington or Oregon which have snowfall data that far back, a strange situation for which I have found no good explanation. However, snowfall totals in recent years are somewhat better than during the 1977-1992 period.
Low-elevation snowpack data:
As with Washington, there are many more sites in Oregon with snowpack data than with the harder-to-measure snowfall, although only a small fraction of snowpack sites are still active and at low elevation. In order to get an adequately large data set, we will need to include all active sites (both snow courses and SNOTEL) with at least 30 years of data. This map shows all active snow courses and SNOTEL sites in Oregon .
Out of 317 total snow courses in Oregon listed in the NRCS database, only 72 are still active and being measured , 65 of those have a period of record of over 30 years, and only 17 of those are at roughly 4500 ft or below in the Cascades. There are 82 SNOTEL sites in Oregon listed in the NRCS database, of which 81 are still active, 70 of those have a period of record of over 30 years, and only 17 of those are at roughly 4500 ft or below in the Cascades. Unlike the Washington data, both snow courses and SNOTEL sites in the Oregon Cascades are combined in a single list here, and will be analyzed together.
Low-elevation snow courses (with alphanumeric IDs) and SNOTEL sites (3-digit numbers) in the Oregon Cascades with at least 30 years of data, sorted by latitude from north to south:
[tt]
site_name start enddate latitude longitude elev county
Greenpoint (504) 1978-October active 45.62 -121.70 3310 Hood River
North Fork (666) 1978-October active 45.55 -122.00 3060 Multnomah
Red Hill (712) 1978-October active 45.46 -121.70 4410 Hood River
Mill Creek Meadow (21D39) 1985-January active 45.45 -121.52 4400 Hood River
Blazed Alder (351) 1980-June active 45.43 -121.86 3650 Clackamas
Mud Ridge (655) 1978-October active 45.25 -121.74 4070 Clackamas
Clear Lake (401) 1980-June active 45.19 -121.69 3810 Wasco
Clackamas Lake (398) 1980-June active 45.10 -121.75 3400 Clackamas
Beaver Creek #1 (21D36) 1982-February active 45.10 -121.61 4210 Wasco
Beaver Creek #2 (21D37) 1982-February active 45.10 -121.61 4220 Wasco
Peavine Ridge (687) 1980-June active 45.04 -121.93 3420 Clackamas
Little Meadows (584) 1978-December active 44.61 -122.23 4020 Linn
Marion Forks (614) 1980-July active 44.59 -121.97 2590 Linn
Daly Lake (434) 1978-December active 44.52 -122.09 3690 Linn
Santiam Jct. (733) 1978-October active 44.44 -121.95 3740 Linn
Jump Off Joe (552) 1978-October active 44.39 -122.17 3520 Linn
Hungry Flat (21F04) 1952-February active 43.99 -121.44 4400 Deschutes
Railroad Overpass (710) 1981-July active 43.66 -122.21 2680 Lane
Salt Creek Falls (729) 1980-July active 43.61 -122.12 4220 Lane
North Umpqua (22F16) 1937-February active 43.31 -122.16 4200 Douglas
Trap Creek (22F17) 1937-February active 43.25 -122.29 3830 Douglas
Red Butte 4 (22F26) 1961-March active 43.20 -122.85 3000 Douglas
Red Butte 3 (22F25) 1961-January active 43.20 -122.87 3500 Douglas
Red Butte 2 (22F24) 1960-January active 43.19 -122.86 4050 Douglas
Red Butte 1 (22F23) 1960-January active 43.17 -122.88 4460 Douglas
Silver Burn (22G02) 1937-March active 42.93 -122.40 3680 Jackson
King Mountain 4 (23G11) 1967-February active 42.75 -123.18 3050 Jackson
King Mountain 3 (23G10) 1961-January active 42.74 -123.17 3680 Jackson
King Mountain 1 (23G08) 1961-January active 42.72 -123.20 4760 Jackson
King Mountain (558) 1980-June active 42.72 -123.20 4340 Jackson
Fish Lk. (479) 1980-June active 42.38 -122.35 4660 Jackson
Deadwood Junction (22G27) 1960-January active 42.29 -122.38 4660 Jackson
Howard Prairie (22G26) 1959-January active 42.21 -122.37 4580 Jackson
Siskiyou Summit Rev. (22G35) 1932-January active 42.07 -122.61 4560 Jackson
[/tt]
It works out nicely that the highest of our "low-elevation" sites are all located at the southernmost end of the Oregon Cascades, where it makes the most sense to include slightly higher elevations in the low-elevation band.
Continued in next post, exceeded 20,000 character limit AGAIN . . .
[hr]Has the low-elevation snowpack in the Oregon Cascades been declining over the past 2-3 decades??
First of all, let's review the snow climatology of the Oregon Cascades as essential background before looking at the data:
The 250-mile north-south extent of the Oregon Cascades forms a transition zone between two very different climatic regimes, a smooth gradient connecting the cooler and wetter "Pacific Northwet" climate zone (which extends from Washington north through coastal BC and into southeast Alaska) with the warmer and sunnier Mediterranean-type climate zone which covers much of California. Snowfall and snowpack in the Pacific Northwest zone has very strong positive correlations to the cool phase of both the ENSO (La Nina) and PDO cycles as discussed above in the first post, while in California the snowfall and snowpack (and precip) has very strong positive correlations to the warm phase of the ENSO cycle (El Nino), but has uncertain correlations to PDO (probably not well correlated, but I'm not sure if this has been studied much at all).
The northern Oregon Cascades (the northern 1/3 from the Columbia Gorge past Mount Hood south to Mount Jefferson and Santiam Pass) are very similar climatologically to the southern Washington Cascades (which extend from just south of Snoqualmie Pass to the Columbia Gorge including Mounts Rainier, Adams, and Saint Helens). Also similarly, the east side of the northern Oregon Cascades features a substantial deep basin (the Columbia Basin) with elevations of typically 1000-2000 ft, just like the east side of the southern and central Washington Cascades.
The southern Oregon Cascades (the southern 1/3 from the Klamath River at the California border, north past Mount McLoughlin, Crater Lake, and Mount Thielsen) are fairly similar climatologically to the California Cascades (which extend from the Klamath River south through Mount Shasta and Lassen Peak to the northern edge of the Sierra Nevada at Lake Almanor and the North Fork Feather River). The southern Oregon Cascades are much drier and sunnier than the northern Oregon Cascades, and the southernmost part (from about Mount McLoughlin south) is substantially rain-shadowed by the 7000+ ft peaks of the Siskiyou Mountains to their west and southwest.
In between south and north, the central Oregon Cascades (from Santiam Pass through the Three Sisters group south to Diamond Peak) form the heart of the climatic transition zone. The east side of both the central and southern Oregon Cascades features a substantial high plateau (the High Desert) ranging from about 3000-5000 ft, very similar to the California Cascades (with the Modoc Plateau to their east) in that regard.
Just as in Washington, a very sharp east-west climatic separation also occurs along the crest of the Oregon Cascades, with generous annual precip of up to 100-140" along the wet west slopes (highest in the northern part) and a rain-shadowed semi-desert with meager annual precip of barely 10-20" along the dry east slopes and the adjacent High Desert plateau. The west side of both the southern and central Oregon Cascades (and extending partway along the northern Oregon Cascades) also includes a substantial region of lower, older foothills known as the Western Cascades, which extend far west of the crest.
Based on these known climatological factors, we can try to guess what to expect when we look at the data here. For the northern Oregon Cascades, we should expect to find results similar to those of Washington, with near-normal snowpacks in recent years and strong correlation to the PDO cycle. For the southern Oregon Cascades, the situation is likely to be somewhat different, as the effects of the current historically-unprecedented California drought (already 3 full years, and very possibly heading into a fourth) have definitely now extended north into this region. As for the central Oregon Cascades, it's hard to say which way it might lean (closer to northern or southern) during the recent time period or what its historic trends might look like. Let's analyze some relevant data and try to find out.
What low-elevation snow data exists for Oregon?
Once again, we need to define "low-elevation" in this case. Using a similar methodology to Washington, the lower limit of useful snow data is about 2000-2500 ft in the north and 3000-3500 ft in the south, as extreme random variation dominates the snow data at sites below that level. The top of the low-elevation band extends up to about 4500 ft, which includes the lowest passes across the Cascade Crest in Oregon (all between Mount Hood and Olallie Butte, including Barlow Pass, Wapinitia Pass, Abbot Pass, etc.) while excluding all other Cascade Crest passes farther south through the California border. Therefore we'll consider data from about 2500-4500 ft as low-elevation for snowfall and snowpack data in Oregon, while 4500-6500 ft would be considered mid-elevation, and 6500-8000 ft are the highest elevations at which such data is available. Just as in Washington (where each band is about 1000 ft lower), the mid-elevation band contains the overwhelming majority of snowpack measurement sites, with far fewer in the low or especially the high elevation ranges.
At low elevations of 2500-4500 ft that we are considering, and even looking for data that only extends back at least 35-40 years, there are barely a handful of sites in the Oregon Cascades with reasonably complete snowfall and snowdepth data over that period (if there are any other such sites, I have not found them thus far). Thankfully, through pure chance these 5 sites are nicely distributed over the entire length of the Oregon Cascades:
[tt]
Government Camp 3980 ft 45.30 -121.74 on the south side of Mount Hood
Marion Forks Fish Hatchery 2480 ft 44.61 -121.95 west of Mount Jefferson
Wickiup Dam 4360 ft 43.68 -121.69 south of Mount Bachelor
Lemolo Lake 3 NNW 4080 ft 43.36 -122.22 near Diamond Lake
Howard Prairie Dam 4570 ft 42.23 -122.38 south of Mount McLoughlin
[/tt]
Here are plots of the snowfall data at these 5 sites with several running averages superimposed (data from WRCC and NCDC ):
Government Camp (3980 ft) is located on the southern flanks of Mount Hood, about 6 miles SSW of the summit and 3 miles west of the Cascade Crest (which goes up the south side of Hood just west of the White River drainage). It has an average annual precip of 88" to produce its 270" average annual snowfall, which is less than half the average annual snowfall of over 550" with 110" of precip recorded at Timberline Lodge (5900 ft), about halfway from Govy to the summit. Government Camp has one of the longest historical climate records of any mountain location in the entire Cascade Range, with weather records including snowfall and snowdepth extending back to 1895. The current Government Camp site has data back to 1951, while prior to that from 1895-1951 the records are listed under "Summit Guard Station" with the same coordinates and an elevation of 3900 ft, so the snowfall may not have been recorded at the same exact location. Note that prior to 1941, the annual snowfall totals shown above only include data from November through March, so the annual snowfall is being under-reported by roughly 10-15% on average due to missing April (which averages about 26" for the month) and October and May (which each average about 6"). I considered leaving those years out of the plot, but decided to include them with that disclaimer.
Overall, the snowfall data for Government Camp looks very similar to that from Longmire (to which it appears to be quite well-correlated) and Snoqualmie Pass in the Washington Cascades, with recent years generally having above-normal snowfall following a low period from 1977-1996, which was preceded by well above-normal snowfall from the mid-1940s through 1976. Just as expected from the basic climatology of the northern Oregon Cascades discussed above.
The Marion Forks Fish Hatchery (2480 ft) is located on the floor of a large glacial trough which extends down from Marion Lake into the North Santiam River valley, about 8 miles WSW of the summit of Mount Jefferson and 7 miles west of the Cascade Crest. It has an average annual precip of 70" to produce its 110" average annual snowfall, but its very low elevation results in extreme variability in the snowfall numbers, with annual totals spanning an almost unbelievable range from nearly 300" in the biggest years to only 6" in the record low year, a factor of almost 50 from highest to lowest! Despite that variability, the long-term pattern is fairly similar to that of Government Camp and the Washington Cascades, with the past 9 years being much better than 1977-2005, and a period of generally larger snowfalls before that.
Wickiup Dam (4360 ft) is located well out on the dry eastern flank of the central Oregon Cascades, about 14 miles east of Maiden Peak on the Cascade Crest near Willamette Pass and 20 miles south of Mount Bachelor. With an average annual precip of only 20" to produce its almost 80" average annual snowfall, this is clearly in a very different climate than either of the preceding 2 sites. The pattern of snowfall years reflects this difference, as it looks nothing like those 2 sites or any of the 5 sites graphed in Washington. Quite interestingly, it shows almost no long-term trends at all, with its large annual variations superimposed on a nearly flat long-term average, perhaps even with a very slight upward trend if at all. Unfortunately, data for the past 2 years is very spotty and largely missing, so it is unclear if the high-quality snow data from this site will continue or not.
The Lemolo Lake 3 NNW site (4080 ft) is located 3 miles NW of Lemolo Lake, about 9 miles west of Windigo Pass on the Cascade Crest, about 12 miles SSW of Diamond Peak and 12 miles NNW of Diamond Lake. Although only about 35 miles SW of Wickiup Dam, it is in a much wetter climate on the west side of the range, with an average annual precip of 65" to produce its almost 220" average annual snowfall. Over its fairly short 36-year period of record, this site also shows almost no long-term trends at all, although the past 3 seasons have all been below normal due to the effects of the California drought extending north into this part of the southern Oregon Cascades.
Howard Prairie Dam (4570 ft) is located about 15 miles SSW of Mount McLoughlin and 15 miles north of the California border, about 9 miles west of the Cascade Crest. Despite being west of the Crest, due to rain-shadowing from the 7000+ ft peaks of the Siskiyou Mountains to the west and southwest, this is a much drier climate than areas farther north like Lemolo Lake, with an average annual precip of 32" to produce its almost 140" average annual snowfall. Although a strong downward long-term trend is not clear, there are definitely more medium-term ups and downs than either of the previous 2 sites, and once again the past 3 seasons have all been below normal due to the effects of the California drought, with 2013-14 sadly posting the all-time record low snowfall at this site over its 50+ year period of record.
For an interesting comparison with the low-elevation sites, here is the data from a much higher elevation site at Crater Lake over the same time period (this plot added on 22Jan2015):
As mentioned in the original post above, Crater Lake National Park Headquarters (6470 ft) in southern Oregon is one of only 2 mid-high elevation sites in the entire Cascade Range with snowfall and snowdepth data extending back for over 90 years. It is far snowier than any other site in southern Oregon, with an average annual precip of 65" to produce its 515" average annual snowfall. The data from Crater Lake clearly shows more of an overall downward trend in snowfall over the entire period back to 1930 than any of the low elevation sites in Washington or Oregon which have snowfall data that far back, a strange situation for which I have found no good explanation. However, snowfall totals in recent years are somewhat better than during the 1977-1992 period.
Low-elevation snowpack data:
As with Washington, there are many more sites in Oregon with snowpack data than with the harder-to-measure snowfall, although only a small fraction of snowpack sites are still active and at low elevation. In order to get an adequately large data set, we will need to include all active sites (both snow courses and SNOTEL) with at least 30 years of data. This map shows all active snow courses and SNOTEL sites in Oregon .
Out of 317 total snow courses in Oregon listed in the NRCS database, only 72 are still active and being measured , 65 of those have a period of record of over 30 years, and only 17 of those are at roughly 4500 ft or below in the Cascades. There are 82 SNOTEL sites in Oregon listed in the NRCS database, of which 81 are still active, 70 of those have a period of record of over 30 years, and only 17 of those are at roughly 4500 ft or below in the Cascades. Unlike the Washington data, both snow courses and SNOTEL sites in the Oregon Cascades are combined in a single list here, and will be analyzed together.
Low-elevation snow courses (with alphanumeric IDs) and SNOTEL sites (3-digit numbers) in the Oregon Cascades with at least 30 years of data, sorted by latitude from north to south:
[tt]
site_name start enddate latitude longitude elev county
Greenpoint (504) 1978-October active 45.62 -121.70 3310 Hood River
North Fork (666) 1978-October active 45.55 -122.00 3060 Multnomah
Red Hill (712) 1978-October active 45.46 -121.70 4410 Hood River
Mill Creek Meadow (21D39) 1985-January active 45.45 -121.52 4400 Hood River
Blazed Alder (351) 1980-June active 45.43 -121.86 3650 Clackamas
Mud Ridge (655) 1978-October active 45.25 -121.74 4070 Clackamas
Clear Lake (401) 1980-June active 45.19 -121.69 3810 Wasco
Clackamas Lake (398) 1980-June active 45.10 -121.75 3400 Clackamas
Beaver Creek #1 (21D36) 1982-February active 45.10 -121.61 4210 Wasco
Beaver Creek #2 (21D37) 1982-February active 45.10 -121.61 4220 Wasco
Peavine Ridge (687) 1980-June active 45.04 -121.93 3420 Clackamas
Little Meadows (584) 1978-December active 44.61 -122.23 4020 Linn
Marion Forks (614) 1980-July active 44.59 -121.97 2590 Linn
Daly Lake (434) 1978-December active 44.52 -122.09 3690 Linn
Santiam Jct. (733) 1978-October active 44.44 -121.95 3740 Linn
Jump Off Joe (552) 1978-October active 44.39 -122.17 3520 Linn
Hungry Flat (21F04) 1952-February active 43.99 -121.44 4400 Deschutes
Railroad Overpass (710) 1981-July active 43.66 -122.21 2680 Lane
Salt Creek Falls (729) 1980-July active 43.61 -122.12 4220 Lane
North Umpqua (22F16) 1937-February active 43.31 -122.16 4200 Douglas
Trap Creek (22F17) 1937-February active 43.25 -122.29 3830 Douglas
Red Butte 4 (22F26) 1961-March active 43.20 -122.85 3000 Douglas
Red Butte 3 (22F25) 1961-January active 43.20 -122.87 3500 Douglas
Red Butte 2 (22F24) 1960-January active 43.19 -122.86 4050 Douglas
Red Butte 1 (22F23) 1960-January active 43.17 -122.88 4460 Douglas
Silver Burn (22G02) 1937-March active 42.93 -122.40 3680 Jackson
King Mountain 4 (23G11) 1967-February active 42.75 -123.18 3050 Jackson
King Mountain 3 (23G10) 1961-January active 42.74 -123.17 3680 Jackson
King Mountain 1 (23G08) 1961-January active 42.72 -123.20 4760 Jackson
King Mountain (558) 1980-June active 42.72 -123.20 4340 Jackson
Fish Lk. (479) 1980-June active 42.38 -122.35 4660 Jackson
Deadwood Junction (22G27) 1960-January active 42.29 -122.38 4660 Jackson
Howard Prairie (22G26) 1959-January active 42.21 -122.37 4580 Jackson
Siskiyou Summit Rev. (22G35) 1932-January active 42.07 -122.61 4560 Jackson
[/tt]
It works out nicely that the highest of our "low-elevation" sites are all located at the southernmost end of the Oregon Cascades, where it makes the most sense to include slightly higher elevations in the low-elevation band.
Continued in next post, exceeded 20,000 character limit AGAIN . . .
Please Log in or Create an account to join the conversation.
- Amar Andalkar
-
Topic Author
- User
-
Less
More
- Posts: 635
- Thank you received: 0
11 years 6 months ago - 11 years 6 months ago #223605
by Amar Andalkar
Replied by Amar Andalkar on topic Re: Has low-elevation Cascade snowpack been declining?
Continued from previous post . . .
Let's do the same type of quick analysis as for the Washington sites, looking at the snowdepth and SWE as a % of normal (1981-2010 median) over the last 9 years 2006 to 2014 at these 34 sites. Once again, sites are arranged in geographic order from north to south along the Cascades, and those 9 seasons are very approximately categorized as above-near-below normal by glancing at the % of normal values.
Columbia Gorge:
Greenpoint (504) 3310 ft (1979-2015, snowdepth installed 2006)
A somewhat rain-shadowed site near the Columbia Gorge, 17 miles north of Mount Hood, average annual precip of 71", median maximum SWE of 19" near March 5
2014 far below-normal, 2013 & 2010 below-normal, 2012 above-normal, 2011 near-normal, 2009 & 2008 & 2007 & 2006 also above-normal
North Fork (666) 3060 ft (1978-2015, snowdepth installed 1996)
Above the Columbia Gorge, 19 miles NW of Mount Hood, average annual precip of 144" (the most of any SNOTEL site in Oregon), median maximum SWE of 17" near April 10
2014 far below-normal, 2013 & 2012 & 2011 above-normal, 2010 near-normal, 2009 & 2008 & 2007 & 2006 also above-normal
North of Mount Hood:
Red Hill (712) 4410 ft (1978-2015, snowdepth installed 2006)
6 miles north of Mount Hood, average annual precip of 110", median maximum SWE of 47" near March 25
2014 below-normal, 2012 & 2011 above-normal, 2013 & 2010 near-normal, 2009 & 2008 & 2007 & 2006 also above-normal
Mill Creek Meadow (21D39) 4400 ft (1985-2015) 10 miles NE of Mount Hood
2014 & 2010 below-normal, 2013 & 2011 near-normal, 2012 & 2009 & 2008 & 2006 above-normal, 2007 insufficient data
Blazed Alder (351) 3650 ft (1981-2015, snowdepth installed 1996)
9 miles NW of Mount Hood, average annual precip of 122", median maximum SWE of 27" near March 25
2014 & 2010 below-normal, 2013 & 2012 & 2011 & 2009 & 2008 & 2006 above-normal, 2007 near-normal
South of Mount Hood:
Mud Ridge (655) 4070 ft (1978-2015, snowdepth installed 1996)
8 miles SSW of Mount Hood, average annual precip of 67", median maximum SWE of 25" near March 1
2014 & 2010 below-normal, 2013 near-normal, 2012 & 2011 & 2009 & 2008 & 2006 above-normal, 2007 near-normal
Clear Lake (401) 3810 ft (1980-2015, snowdepth installed 2005)
12 miles south of Mount Hood, average annual precip of 44", median maximum SWE of 13" near March 1
2014 & 2010 far below-normal, 2013 below-normal, 2012 & 2011 & 2009 & 2008 & 2006 above-normal, 2007 near-normal
Clackamas Lake (398) 3400 ft (1980-2015, snowdepth installed 2002)
19 miles SSW of Mount Hood, average annual precip of 53", median maximum SWE of 13" near March 5
2014 & 2010 far below-normal, 2013 below-normal, 2012 & 2011 & 2009 & 2008 & 2006 above-normal, 2007 near-normal
Farther south of Mount Hood:
Beaver Creek #1 (21D36) 4210 ft (1982-2015) 19 miles SSE of Mount Hood
2014 & 2010 far below-normal, 2013 below-normal, 2012 & 2011 & 2009 & 2008 & 2006 above-normal, 2007 near-normal
Beaver Creek #2 (21D37) 4220 ft (1982-2015) 19 miles SSE of Mount Hood
similar pattern at this adjacent site, which somehow has much lower snowpack despite near-identical elevation
Peavine Ridge (687) 3420 ft (1981-2015, snowdepth installed 2003)
25 miles SSW of Mount Hood, average annual precip of 65", median maximum SWE of 12" near February 20
2014 & 2010 far below-normal, 2013 & 2012 & 2011 & 2009 & 2008 & 2006 above-normal, 2007 near-normal
West of Mount Jefferson:
Little Meadows (584) 4020 ft (1980-2015, snowdepth installed 2003)
21 miles WSW of Mount Jefferson, average annual precip of 113", median maximum SWE of 23" near March 20
2014 far below-normal, 2013 & 2012 & 2011 above-normal, 2010 near-normal, 2009 & 2008 & 2007 & 2006 above-normal
Marion Forks (614) 2590 ft (1980-2015, snowdepth installed 2005)
10 miles SW of Mount Jefferson, 2 miles SW of Marion Forks Fish Hatchery (2480 ft) site with snowfall data shown above,
average annual precip of 80", median maximum SWE of 8" near March 5
2014 & 2010 far below-normal, 2013 & 2012 & 2011 & 2009 & 2008 & 2006 above-normal, 2007 near-normal
Daly Lake (434) 3690 ft (1980-2015, snowdepth installed 2004)
17 miles SW of Mount Jefferson, average annual precip of 86", median maximum SWE of 13" near March 5
2014 & 2010 far below-normal, 2013 & 2012 & 2011 & 2009 & 2008 & 2006 above-normal, 2007 near-normal
Santiam Pass Highway US 20:
Santiam Jct. (733) 3740 ft (1978-2015, snowdepth installed 2004)
18 miles SSW of Mount Jefferson, average annual precip of 74", median maximum SWE of 16" near February 25
2014 & 2010 far below-normal, 2013 & 2012 & 2011 & 2009 & 2008 & 2006 above-normal, 2007 below-normal
Jump Off Joe (552) 3520 ft (1978-2015, snowdepth installed 2002)
27 miles SW of Mount Jefferson, average annual precip of 86", median maximum SWE of 13" near March 5 (same as Daly Lake above)
2014 & 2010 far below-normal, 2013 & 2012 & 2011 & 2009 & 2008 & 2007 & 2006 above-normal
Cascade Lakes Highway near Bend:
Hungry Flat (21F04) 4400 ft (1952-2015)
12 miles east of Mount Bachelor, extremely low snowpack site in a very dry area with about 2" median maximum SWE
2014 & 2013 & 2010 far below-normal, 2012 & 2009 & 2007 below-normal, 2011 & 2008 & 2006 above-normal
Willamette Pass Highway ORE 58:
Railroad Overpass (710) 2680 ft (1981-2015, snowdepth installed 2006)
9 miles WNW of Willamette Pass, average annual precip of 56", median maximum SWE of 0", average maximum SWE of 0.6"!!
This site almost never has measurable snowpack! The link above includes 1981-2010 averages, which are at least non-zero unlike the medians.
Salt Creek Falls (729) 4220 ft (1980-2015, snowdepth installed 2005)
4 miles WNW of Willamette Pass, 6 miles NNE of Diamond Peak, average annual precip of 75", median maximum SWE of 17" near April 1
2014 & 2010 far below-normal, 2013 & 2011 & 2009 & 2008 & 2007 & 2006 above-normal, 2012 near-normal
North Umpqua Highway ORE 138:
North Umpqua (22F16) 4200 ft (1937-2013)
8 miles north of Diamond Lake, just SE of Lemolo Lake, 5 miles SE of Lemolo Lake 3 NNW (4080 ft) site with snowfall data shown above
2013 & 2007 below-normal, 2012 & 2011 & 2009 & 2008 & 2006 above-normal, 2010 far below-normal
Trap Creek (22F17) 3830 ft (1937-2013)
7 miles NW of Diamond Lake along ORE 138, 7 miles NNW of Mount Bailey
2013 & 2012 & 2011 & 2009 & 2008 & 2006 above-normal, 2010 far below-normal, 2007 near-normal
Western Cascades, 25 miles east of Roseburg, 35 miles west of Diamond Lake and 40 miles west of the Cascade Crest:
Red Butte 4 (22F26) 3000 ft (1961-2015)
This site almost never has measurable snowpack! The link above includes 1981-2010 averages, which are at least non-zero unlike the medians.
Red Butte 3 (22F25) 3500 ft (1961-2015)
This site has extremely low snowpack! The link above includes 1981-2010 averages, which are at least useful unlike the tiny medians.
Red Butte 2 (22F24) 4050 ft (1960-2015)
At least this site is high enough to have some snowpack most years! Except 2014 which was zero!
Red Butte 1 (22F23) 4460 ft (1960-2015)
2014 & 2010 far below-normal, 2013 & 2012 & 2011 & 2009 & 2008 & 2007 & 2006 above-normal
West of Crater Lake:
Silver Burn (22G02) 3680 ft (1937-2015) 11 miles west of Crater Lake along ORE 62
2014 & 2010 far below-normal, 2013 & 2012 & 2007 near-normal, 2011 & 2009 & 2008 & 2006 above-normal
Western Cascades, 5 miles SE of I-5, 20 miles NNE of Grants Pass, 50 miles west of the Cascade Crest:
King Mountain 4 (23G11) 3050 ft (1967-2015)
King Mountain 3 (23G10) 3680 ft (1961-2015)
These 2 lower sites almost never have measurable snowpack! The links above include 1981-2010 averages, which are at least non-zero unlike the medians.
King Mountain 1 (23G08) 4760 ft (1961-2015)
2014 far below-normal, 2013 & 2012 & 2011 & 2009 & 2008 & 2007 & 2006 above-normal, 2010 below-normal
King Mountain (558) 4340 ft (1980-2015, snowdepth installed 2006)
Very low snowpack, hard to categorize reliably, average annual precip of 62", median maximum SWE of 3" near March 1
South of Mount McLoughlin:
Fish Lk. (479) 4660 ft (1981-2015, snowdepth installed 2006)
5 miles SSW of Mount McLoughlin, average annual precip of 46", median maximum SWE of 12" near March 5
2014 & 2010 far below-normal, 2013 & 2011 & 2009 & 2008 & 2006 above-normal, 2012 & 2007 near-normal
Deadwood Junction (22G27) 4660 ft (1960-2015)
11 miles SSW of Mount McLoughlin, along Dead Indian Memorial Road
2014 near-zero snowpack, 2010 far below-normal, 2013 & 2011 & 2009 & 2008 & 2006 above-normal, 2012 & 2007 near-normal
Howard Prairie (22G26) 4580 ft (1959-2015)
15 miles SSW of Mount McLoughlin, 1 mile SE of Howard Prairie Dam (4570 ft) site with snowfall data shown above
2014 near-zero snowpack, 2010 far below-normal, 2013 & 2011 & 2009 & 2008 & 2006 above-normal, 2012 & 2007 near-normal
Siskiyou Summit:
Siskiyou Summit Rev. (22G35) 4560 ft (1932-2015)
30 miles SW of Mount McLoughlin, 0.5 mile NW of 4310 ft Siskiyou Summit (highest point on I-5), near the border between Cascade Range and Siskiyou Mountains
2014 zero snowpack (!), 2013 & 2012 & 2011 & 2009 & 2008 & 2007 & 2006 above-normal, 2010 below-normal
Continued in next post, exceeded 20,000 character limit AGAIN . . .
Please Log in or Create an account to join the conversation.
- Amar Andalkar
-
Topic Author
- User
-
Less
More
- Posts: 635
- Thank you received: 0
11 years 6 months ago #223606
by Amar Andalkar
Replied by Amar Andalkar on topic Re: Has low-elevation Cascade snowpack been declining?
Continued from previous post . . .
Conclusions on the snowpack in the Oregon Cascades:
Well, as in Washington, the overall answer to the question appears to be a solid No! The low-elevation snowpack in the Oregon Cascades has not been declining over the past 2-3 decades!
In particular, the most recent decade is no worse than 2-3 decades ago, and in fact appears to have slightly better low-elevation snowpacks. This is most definitely true in the northern Oregon Cascades which match the southern Washington Cascades quite well, and also appears to hold true in both the central and southern Oregon Cascades too, other than 2014 which was a disastrously poor snow year in the southern end, with near-record lows for snowpack and snowfall at many sites. The poor 2014 at the southern end was expected given that 2014 was the worst drought year in California since 1977, but the fact that the previous 2 years were generally above-normal comes as a bit of a surprise given that 2012 and 2013 were the first two years of the current California drought, and that the snowfall numbers shown earlier for the 2 southern sites were slightly below-normal for those years too.
What about the Coast Ranges? The Olympics, Oregon Coast Range, Klamath & Siskiyou Mountains
In the Washington "Coast Ranges" (i.e. the Olympic Mountains and Willapa Hills), there are no active snow courses or SNOTEL sites within the 1500-3500 ft low-elevation band there, and only a handful of sites period, all above 4000 ft in the Olympics. In the Oregon part of the Siskiyou Mountains, there is only a single site in the low-elevation band (Siskiyou Summit) which was already included in the analysis above.
But in the Oregon Coast Range, there are 2 SNOTEL sites and 1 snow course with at least 30 years of data, all in the northern half of the range:
[tt]
site_name start enddate latitude longitude elev county
Saddle Mountain (726) 1978-November active 45.54 -123.37 3110 Washington
Seine Creek (743) 1980-June active 45.53 -123.30 2060 Washington
Marys Peak Rev. (23E04) 1938-February active 44.51 -123.56 3580 Benton
[/tt]
Might as well take a quick look at these sites too in case there are any surprises to be found:
Wilson River Highway, ORE 6:
Saddle Mountain (726) 3110 ft (1979-2015, snowdepth installed 1998)
Average annual precip of 98", median maximum SWE not given, average maximum SWE of 6", NOTE: 1971-2000 normals used since 1981-2010 are missing
2014 near-zero snowpack, 2012 & 2010 & 2006 far below-normal, 2013 & 2011 & 2008 above-normal, 2009 & 2007 very variable
Seine Creek (743) 2060 ft (1981-2015, snowdepth installed 2000)
Average annual precip of 73", median maximum SWE of 0.2", average maximum SWE of 1.8"!!
This site almost never has measurable snowpack! The link above includes 1981-2010 averages, which are at least non-zero unlike the medians.
Corvallis-Newport Highway, US 20:
Marys Peak Rev. (23E04) 3580 ft (1938-2015)
2014 near-zero snowpack, 2013 & 2012 & 2011 & 2009 & 2008 & 2007 & 2006 above-normal, 2010 below-normal
Well, it's hard to tell much from such a small sample size, but at first glance these sites appear to be more closely correlated with areas in the southern part of the Western Cascades, while not really matching the annual pattern of the northern Oregon Cascades which are located directly east of these sites. The snowpack at the northern Wilson River sites has definitely been terrible in several recent years, the worst of any location looked at in this entire study in Oregon or Washington, but in sharp contrast the Marys Peak site farther south and slightly higher has had mostly above-normal years. Not much more can be said based on the limited data which is available.
And what about the southernmost part of the Cascade Range, the California Cascades?
There appears to be very little low-elevation snow data in this region, but a detailed analysis of whatever is available is underway . . .
Please Log in or Create an account to join the conversation.
- Amar Andalkar
-
Topic Author
- User
-
Less
More
- Posts: 635
- Thank you received: 0
11 years 6 months ago #223607
by Amar Andalkar
Replied by Amar Andalkar on topic Re: Has low-elevation Cascade snowpack been declining?
Reserved for posting California Cascades data and analysis . . .
Please Log in or Create an account to join the conversation.
- mccallboater
-

- User
-
Less
More
- Posts: 11
- Thank you received: 0
11 years 6 months ago #223627
by mccallboater
Replied by mccallboater on topic Re: Has low-elevation Cascade snowpack been declining?
I'd love to see the same analysis of the interior ranges. Selkirks, Bitterroots, West Central Idaho, Sawtooths. I'm seeing big changes (warmer) at the middle elevations there. So does the U of I.
But does warmer mean less snow?
But does warmer mean less snow?
Please Log in or Create an account to join the conversation.