- Posts: 635
- Thank you received: 0
Has low-elevation Cascade snowpack been declining?
- Amar Andalkar
-
 Topic Author
- User
-

Less
More
11 years 6 months ago - 11 years 6 months ago #223539
by Amar Andalkar
Has low-elevation Cascade snowpack been declining? was created by Amar Andalkar
See the previous discussion which led to this post:
Lyman Lake SNOTEL hits 100" snowdepth!?! 05Jan2015
[hr]Has the low-elevation snowpack in the Washington Cascades been declining over the past 2-3 decades??
(What about the Oregon Cascades? Please see Reply #19 below for that analysis.)
Many long-time Northwest skiers have been making the following claims, especially early last year and once again this year, in the face of far below-normal early-season snowpacks:
* The low-elevation Cascade snowpack is declining, and declining a lot in recent years.
* They can remember a time about 2-3 decades ago with much more substantial low-elevation Cascade snowpack almost every year.
* That such persistent low-elevation snowpacks have almost vanished in recent years, except for maybe an occasional exceptional year.
Most of the backcountry skiers that I know and ski with would almost certainly agree with these claims, and some of them are the ones making such claims. But are these claims true? Are the collective memories of these skiers, recalling halcyon days of abundant low-elevation snowfall now long-gone, actually real? Has the low-elevation Cascade snowpack really vanished, never (or rarely) to be seen again in the face of global warming?
No one likes to have their memory or recollection of events brought into question. But as is well known, human memory is one of the most fallible and least reliable sources of evidence or testimony for any particular topic or investigation. It is subject to enormous bias (especially selection bias, indeed selective memory) and numerous potential sources of outright error (such as forgetting crucial details, dates, locations, etc.), mostly perhaps unintentional errors and unbeknownst to the person doing the recollection. So we need to find some hard data to either support or refute these memory-based claims.
Based on the wide range of ages of these experienced skiers making such claims (ages I would guess roughly from 40 to 60+), the period in question that we need to consider extends back only about 2-3 decades, at most 4 decades. Time periods farther back than the mid-1970s are not relevant to these claims, since the claims are not saying that the snowpack was better 50 or 60 years ago, they are really referring to much shorter periods like 2-3 decades, maybe 4. Even so, we will analyze back at least 5-6 decades or longer in order to get a more complete picture of the data and how the snowpack has changed over time.
Since this topic is absolutely about climate change and its effects (and thus sure to be controversial), I should add a disclaimer and disclosure section:
In the interest of full disclosure, I'm a scientist but not in atmospheric or climate science, a PhD physicist and a former member of the research faculty in the UW physics department for nearly 6 years. Whatever I know about snow climatology has been self taught and self learned, as atmospheric science (especially as it relates to snow) has been an intellectual hobby of mine for nearly 2 decades. Let me also state my personal views on climate change up front: I find the data and evidence in support of "global warming" (i.e. anthropogenic climate-change since the start of the Industrial Revolution) to be overwhelming and convincing -- there is no reasonable doubt that the planet is warming, there is no reasonable doubt that most glaciers worldwide are shrinking, there is no reasonable doubt that global CO2 levels are rising, and there is very little doubt that human activities are among the primary contributors to these easily observable and measurable changes.
So I'm certainly not one of those wingnut climate-change deniers, in fact politically I'm at the far left end of the spectrum and oftentimes a one-issue environmental voter. But I also have no financial or academic connection to climate science or research in that area, and thus have no hidden agenda of trying to link everything (especially negative or unpleasant things like vanishing snowpack) to climate change in order to get grant money or publish papers. If climate change is not the cause of something, I am free to say so and will say so. I do my snow climatology research purely out of my own intellectual curiosity and a strong desire to learn the real answers.
So back on topic: the globe is warming, for sure -- but does that mean that the low-elevation Cascade snowpack must be declining over the past 2-3 decades as the globe continues to warm? I spent most of Sunday and Monday doing a detailed study of all available and relevant low-elevation snowpack data from the Washington Cascades, and the results may be shocking to some. Contrary to what you may expect, the answer is . . . No! Not at all!
Frankly, I was expecting that result, but the data is really quite STUNNING, far more positive than I would have guessed: over the last 9 years, most years are actually above-normal at most low-elevation sites in the Washington Cascades! In sharp contrast, most years during the 2-decade period from 1977-1996 were below normal, often well below-normal, with only a few slightly above-normal years. In other words, the very heart of the supposedly-great old-time period of deep low-elevation snowpacks 2-3 decades ago was in fact the worst period for low-elevation snowpack (and any-elevation snowpack) in the Washington Cascades over the last 70 years! The data clearly shows this, and there is little doubt. No fancy statistics needed either, just look at the data presented below!
I'll try to explain and show the following things so that this will hopefully be very clear and make sense:
* What causes year-to-year variability in snowfall and snowpack?
* What does "low-elevation" mean in this context?
* What "low-elevation" data actually exists that is relevant to this question?
* What does that low-elevation data show about snowpack over the past 20, 30, 40 years?
First some background on Cascades snow climatology, which is essential for understanding what is going on:
Annual snowfall (the cumulative total of new snow received in a year) and snowpack (the sitting depth of snow on a specified date such as January 1 or April 1) is highly variable from year-to-year at any location in the Cascades, and also in all other mountain regions of the world, and in all lowland regions of the world which receive snowfall too. Unlike temperature (which can only vary slightly from year-to-year) and precipitation (which can vary more significantly but still within moderate limits except in desert regions), both snowfall and snowpack tend to vary wildly from year-to-year, with the variations often being greater than the average values, and largely random in nature. The year-to-year variability is greatest at lower elevations and lower latitudes and wherever annual snowfall is low, while tending to be much less in areas of very large annual snowfall, at higher elevations near treeline, or at higher latitudes such as sub-Arctic areas (in the Northern Hemisphere) or in Antarctica (in the Southern Hemisphere) even though those areas don't actually get very much snowfall relatively-speaking.
For example, in almost every city in the US or Canada which gets snowfall (outside sub-Arctic regions), the snowfall totals vary wildly from year to year, and a deep seasonal snowpack rarely develops, resulting in even greater year-to-year variability in the snowdepth on any given date than in the very-volatile snowfall numbers. Similarly at "low elevations" in mountain regions throughout the western US (low being relative and specific to each mountain region), there is extreme year-to-year variability, with stable snowpacks and some degree of predictability only above certain threshold elevations.
At elevations below about 1500-2000 ft in the Washington Cascades, there is simply too much year-to-year variability in snowfall and snowpack to make any sense of the data. It is dominated by random variation and is not correlated or correlatable to anything, and is thus not useful for this purpose or most others. In addition, due to this extreme variability, snowfall and snowdepth data is not generally collected in these very low elevation areas, except in towns or other areas with established populations.
So that sets a lower limit on what we can analyze, which actually corresponds nicely to what skiers think of as "low-elevation" here, the lower limit of skiable terrain. Therefore we'll consider data from about 1500-3500 ft as low-elevation. Our low-elevation range thus includes Snoqualmie Pass (3000 ft) as it really must, while excluding all other Cascade Crest passes. In general, 3500-5500 ft would be considered mid-elevation for snowfall data in the Washington Cascades, while 5500-7000 ft are the highest elevations at which such data is available. The corresponding elevation bands in the Oregon Cascades are about 1000 ft higher, and 2000 ft higher in the California Cascades, although this analysis will be limited to the Washington Cascades only at this point (due to time constraints).
In the Cascades, year-to-year snowfall and snowpack variability increases substantially as one moves south along the nearly 800-mile length of the range from southwestern BC to northern California, and increases even more as one continues further south along the nearly 400-mile extension of the Sierra Nevada. These annual variations are fairly well-correlated to 2 major ocean-atmosphere cycles which affect sea-surface temperatures in the Pacific Ocean: the El Nino Southern Oscillation (ENSO), which has a timescale of a few years, and the Pacific Decadal Oscillation (PDO), with a timescale of a few decades. The ENSO cycle is very well studied and is definitely not periodic, nor is it predictable years in advance, and the PDO appears to share those 2 characteristics, although it is much less well studied. Its roughly 10-times longer timescale makes determining periodicity or predictability all but impossible given that barely a couple of PDO cycles have been observed over the past century of scientific data.
Snowfall and snowpack in the Cascades has a very strong positive correlation to the cool phase of ENSO (La Nina), a correlation which extends throughout the entire range from north to south and at all elevations, and even extends (more weakly positive) into the Sierra Nevada. In contrast, the warm phase of ENSO (El Nino) has much more complicated correlations, being very strongly positive for snowfall and snowpack (and precip) in the Sierra Nevada and California Cascades, but weakly negative for snowfall and snowpack in the Washington and Oregon Cascades (more strongly negative at low elevations), and again somewhat positive in southwestern BC especially at higher elevations. See my Cascade ENSO Snowfall webpage, which was created a decade ago and was the first comprehensive analysis of ENSO effects in the Cascades at elevations relevant for skiing and ski mountaineering, for more details about these correlations.
As for the PDO, I know of no similar study, but the correlations appear to be fairly obvious in this case, especially for the Cascades and southern BC: the cool phase of the PDO corresponds to 1-3 decade-long periods of generally well above-normal snowfall and snowpack (although some individual years may still end up well below-normal), while the warm phase brings 1-3 decade-long periods of generally below-normal snowfall and snowpack (although some individual years may still end up above-normal). Here is a plot of the monthly PDO index from 1900-2013 from the UW JISAO :
So the 1-3 decade-long periods of blue match up with 1-3 decade-long periods of above-normal snowfall, and vice-versa for the red (it's best to ignore the shorter variations and glitches in this monthly data, try to see the bigger smoothed picture). The 1930s and early 1940s were a terrible time period for Cascade snowfall, easily the worst in the historical record. That was followed by a long golden age of just under 3 decades, from the late 1940s through 1976, marked by numerous years of extremely high and record-setting snowfall, including at very low elevations in the 1950s. Then everything flipped in 1977 with one of the worst snow years ever on the entire West Coast, ushering in a 2-decade period of the dark ages, with mediocre to below normal snowfall most years and no huge snowfall years at all. The mid-90s saw the tide turn once again, cemented by the huge record-setting years of 1997 and 1999, followed by numerous other above-average years in the 2000s, including huge years in 2008 and 2011.
This multi-decadal PDO pattern is absolutely crucial to understanding any of this! Why? Let's say you're gonna do a big study of Northwest snowpack, and decide to run your data set from 1950-1997 as in the Mote papers which claimed to show huge declines in Northwest mountain snowpack (to find the papers, Google search for Mote snowpack). Thus your data starts in the midst of an extended period of above-normal snowfall years in the 1950s, and ends just after a long run of below-normal snowfall years in the 1980s and early 1990s, and then you fit a line to it -- obviously the line is going to slope downward, and make it look (erroneously!) as if the snowpack is decreasing precipitously over that period. The obvious flaw in their methodology is so mind-boggling and appalling, there's just nothing nice that can be said about their study. Badly done "science", and also pushing a pro climate-change agenda -- even though I happen to agree with the agenda, there's no way for any objective evaluation to agree with their flawed results. And worst of all, they had an easy fix: they could have only included data from sites which extended back to 1930 or earlier, leaving out the sites which only go back to 1950, which would have reduced their data set by a large amount -- but also made their false downward trend lines flatten out completely and moved their study closer to the realm of legitimate science, versus faulty conclusions drawn from a selectively cut data set.
What low-elevation snow data exists? And what does the data show?
Useful snowfall or snowpack data in the Cascades extends back for about one century, with data from Mount Rainier back to 1909 at Longmire (2760 ft) and to 1916 at Paradise (5430 ft). Paradise is absolutely the keystone site in any analysis of Cascade snowfall and snowpack, being one of the only 2 mid-high elevation sites in the entire Cascade Range with snowfall and snowdepth data extending back for over 90 years (Crater Lake Park HQ at 6470 ft in southern Oregon is the other) while also holding the honor of having the greatest average annual snowfall of any measurement site in the world (over 650") and the maximum snowfall ever recorded in a one-year period (over 1200" from February 1971 to 1972). For almost any question that I think of regarding snowfall and snowpack trends, the first site that I look at the data for is Paradise, followed by Crater Lake. It's really unfortunate how few such sites have good snowfall and snowdepth data over such a vast mountain range as the Cascades, as crucially important sites which really should have such data like Mount Baker Ski Area and Mount Hood Timberline, sadly do not have it or only have it for short periods.
But it's pretty much an easily-proven fact (and ought to be well-known by now) that Cascade snowpack at most mid-high elevation sites has actually not been decreasingly significantly (or even at all) over the past few decades -- disregarding highly misleading and erroneous papers like those mentioned above. So we won't worry about the mid-high elevation sites in this at all. What about data at low elevations, that's the real question here.
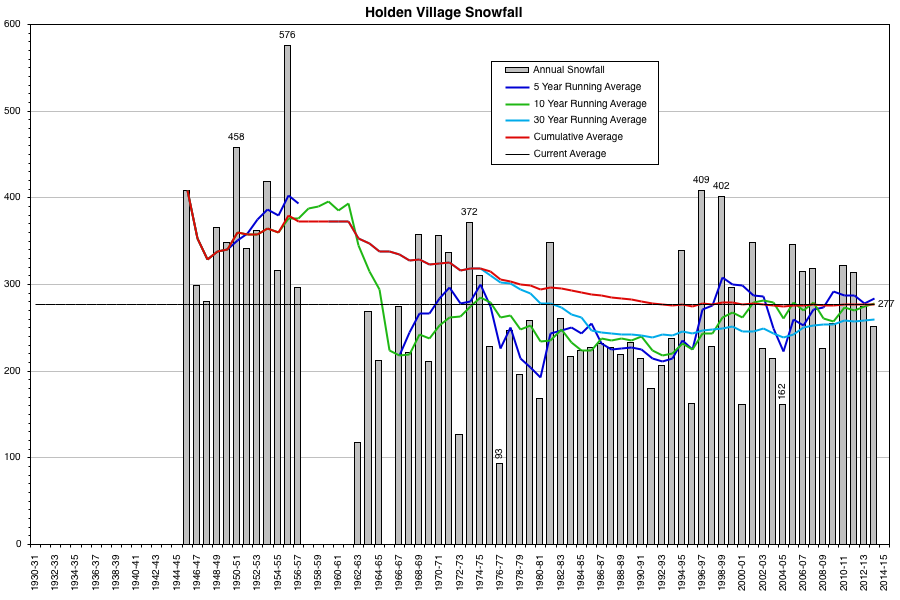
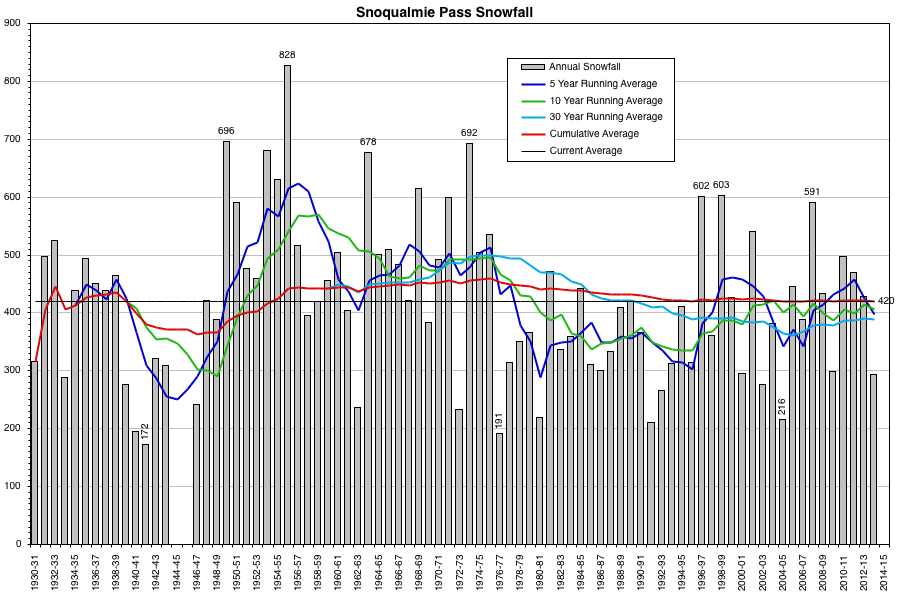
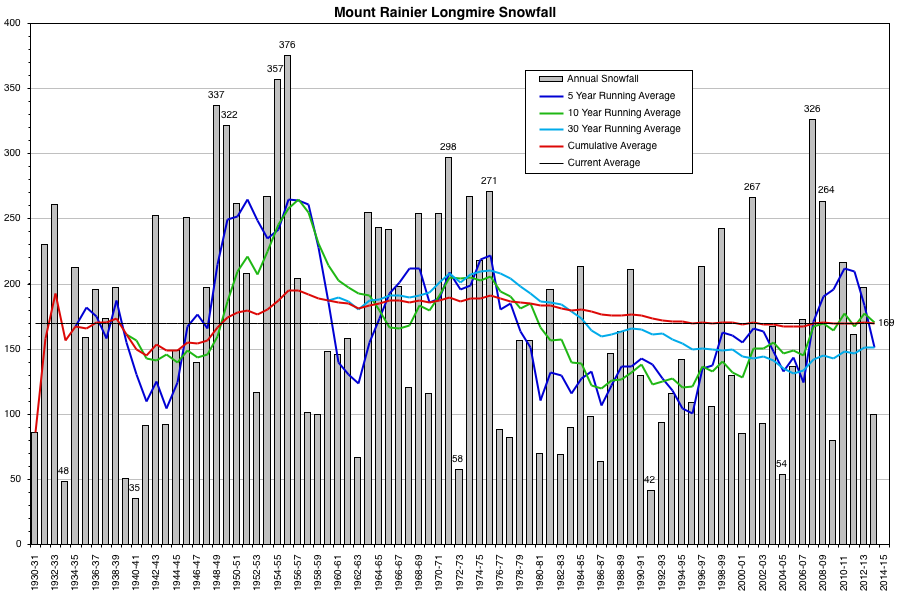
Even at low elevations of 1500-3500 ft as we are considering, and even looking for data that only extends back at least 50 years, there are less than a handful of sites in the Washington Cascades with reasonably complete snowfall and snowdepth data over that period: Longmire (2760 ft), Snoqualmie Pass (3000 ft), and Holden Village (3220 ft). Longmire and Snoqualmie have data back to 1909 and 1910, but the snowfall data is very incomplete with many missing months prior to 1930 at Snoqualmie. At Holden Village, the data prior to 1962 comes from a site listed as "Holden" with the same coordinates but elevation 200 ft higher, so the snowfall may not have been recorded at the same exact location. Here are plots of the snowfall data at these three sites with several running averages superimposed (data from WRCC , NCDC , and WSDOT Snoqualmie Historical Snowfall Records ):
For an interesting comparison with Longmire, here is the data from Paradise over the same time period (this plot added on 22Jan2015):
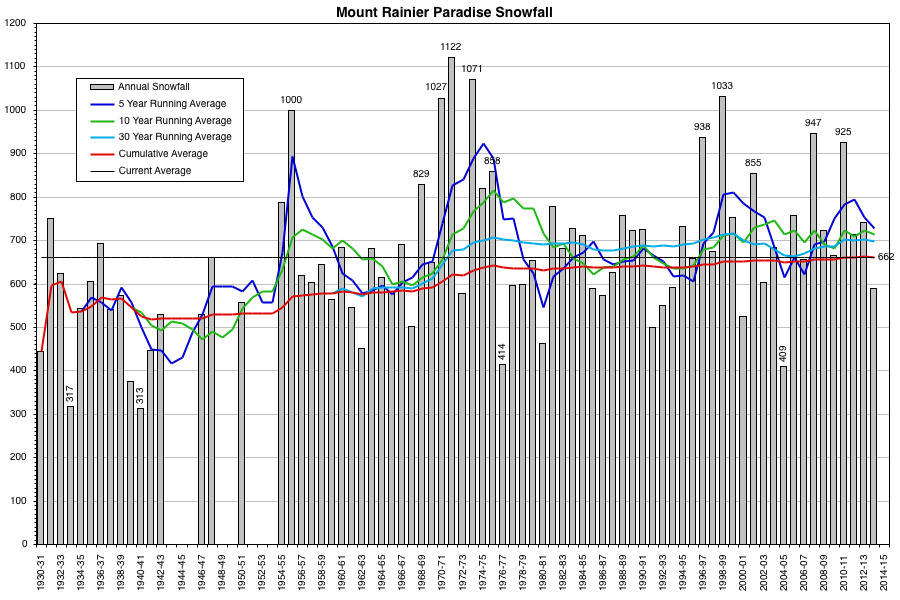
Although these 3 low-elevation sites are located at fairly similar elevations, they obviously receive vastly differing amounts of snowfall and precip. Holden Village is located in the North Cascades about 7 miles east of the Cascade Crest, with an average annual precip of only 40" to produce its 270+" average annual snowfall. Snoqualmie Pass is located at the lowest point on the Cascade Crest in Washington (outside the Columbia Gorge), with an average annual precip of 100" to produce its 420" average annual snowfall. Longmire is located on the southwest side of Mount Rainier about 7 miles from the summit, with an average annual precip of 80" to produce its 170" average annual snowfall. And for comparison, Paradise is on the south side of Mount Rainier about 5 miles from the summit, with an average annual precip of 110" to produce its 660+" average annual snowfall.
Despite these major climatological differences between the 3 low-elevation sites, they all have one thing in common: they do not show a significant reduction in snowfall in recent years! They all do show a sharp reduction in snowfall during the dark ages from 1977-1996, with much greater snowfalls prior to that.
[hr]Please see Reply #16 below for snowfall data at two more low-elevation sites analyzed 3 days after the initial study, Mazama (2170 ft) and Stehekin Company Creek powerhouse (1270 ft).
Continued in next post, exceeded 20,000 character limit . . .
[hr]Has the low-elevation snowpack in the Washington Cascades been declining over the past 2-3 decades??
(What about the Oregon Cascades? Please see Reply #19 below for that analysis.)
Many long-time Northwest skiers have been making the following claims, especially early last year and once again this year, in the face of far below-normal early-season snowpacks:
* The low-elevation Cascade snowpack is declining, and declining a lot in recent years.
* They can remember a time about 2-3 decades ago with much more substantial low-elevation Cascade snowpack almost every year.
* That such persistent low-elevation snowpacks have almost vanished in recent years, except for maybe an occasional exceptional year.
Most of the backcountry skiers that I know and ski with would almost certainly agree with these claims, and some of them are the ones making such claims. But are these claims true? Are the collective memories of these skiers, recalling halcyon days of abundant low-elevation snowfall now long-gone, actually real? Has the low-elevation Cascade snowpack really vanished, never (or rarely) to be seen again in the face of global warming?
No one likes to have their memory or recollection of events brought into question. But as is well known, human memory is one of the most fallible and least reliable sources of evidence or testimony for any particular topic or investigation. It is subject to enormous bias (especially selection bias, indeed selective memory) and numerous potential sources of outright error (such as forgetting crucial details, dates, locations, etc.), mostly perhaps unintentional errors and unbeknownst to the person doing the recollection. So we need to find some hard data to either support or refute these memory-based claims.
Based on the wide range of ages of these experienced skiers making such claims (ages I would guess roughly from 40 to 60+), the period in question that we need to consider extends back only about 2-3 decades, at most 4 decades. Time periods farther back than the mid-1970s are not relevant to these claims, since the claims are not saying that the snowpack was better 50 or 60 years ago, they are really referring to much shorter periods like 2-3 decades, maybe 4. Even so, we will analyze back at least 5-6 decades or longer in order to get a more complete picture of the data and how the snowpack has changed over time.
Since this topic is absolutely about climate change and its effects (and thus sure to be controversial), I should add a disclaimer and disclosure section:
In the interest of full disclosure, I'm a scientist but not in atmospheric or climate science, a PhD physicist and a former member of the research faculty in the UW physics department for nearly 6 years. Whatever I know about snow climatology has been self taught and self learned, as atmospheric science (especially as it relates to snow) has been an intellectual hobby of mine for nearly 2 decades. Let me also state my personal views on climate change up front: I find the data and evidence in support of "global warming" (i.e. anthropogenic climate-change since the start of the Industrial Revolution) to be overwhelming and convincing -- there is no reasonable doubt that the planet is warming, there is no reasonable doubt that most glaciers worldwide are shrinking, there is no reasonable doubt that global CO2 levels are rising, and there is very little doubt that human activities are among the primary contributors to these easily observable and measurable changes.
So I'm certainly not one of those wingnut climate-change deniers, in fact politically I'm at the far left end of the spectrum and oftentimes a one-issue environmental voter. But I also have no financial or academic connection to climate science or research in that area, and thus have no hidden agenda of trying to link everything (especially negative or unpleasant things like vanishing snowpack) to climate change in order to get grant money or publish papers. If climate change is not the cause of something, I am free to say so and will say so. I do my snow climatology research purely out of my own intellectual curiosity and a strong desire to learn the real answers.
So back on topic: the globe is warming, for sure -- but does that mean that the low-elevation Cascade snowpack must be declining over the past 2-3 decades as the globe continues to warm? I spent most of Sunday and Monday doing a detailed study of all available and relevant low-elevation snowpack data from the Washington Cascades, and the results may be shocking to some. Contrary to what you may expect, the answer is . . . No! Not at all!
Frankly, I was expecting that result, but the data is really quite STUNNING, far more positive than I would have guessed: over the last 9 years, most years are actually above-normal at most low-elevation sites in the Washington Cascades! In sharp contrast, most years during the 2-decade period from 1977-1996 were below normal, often well below-normal, with only a few slightly above-normal years. In other words, the very heart of the supposedly-great old-time period of deep low-elevation snowpacks 2-3 decades ago was in fact the worst period for low-elevation snowpack (and any-elevation snowpack) in the Washington Cascades over the last 70 years! The data clearly shows this, and there is little doubt. No fancy statistics needed either, just look at the data presented below!
I'll try to explain and show the following things so that this will hopefully be very clear and make sense:
* What causes year-to-year variability in snowfall and snowpack?
* What does "low-elevation" mean in this context?
* What "low-elevation" data actually exists that is relevant to this question?
* What does that low-elevation data show about snowpack over the past 20, 30, 40 years?
First some background on Cascades snow climatology, which is essential for understanding what is going on:
Annual snowfall (the cumulative total of new snow received in a year) and snowpack (the sitting depth of snow on a specified date such as January 1 or April 1) is highly variable from year-to-year at any location in the Cascades, and also in all other mountain regions of the world, and in all lowland regions of the world which receive snowfall too. Unlike temperature (which can only vary slightly from year-to-year) and precipitation (which can vary more significantly but still within moderate limits except in desert regions), both snowfall and snowpack tend to vary wildly from year-to-year, with the variations often being greater than the average values, and largely random in nature. The year-to-year variability is greatest at lower elevations and lower latitudes and wherever annual snowfall is low, while tending to be much less in areas of very large annual snowfall, at higher elevations near treeline, or at higher latitudes such as sub-Arctic areas (in the Northern Hemisphere) or in Antarctica (in the Southern Hemisphere) even though those areas don't actually get very much snowfall relatively-speaking.
For example, in almost every city in the US or Canada which gets snowfall (outside sub-Arctic regions), the snowfall totals vary wildly from year to year, and a deep seasonal snowpack rarely develops, resulting in even greater year-to-year variability in the snowdepth on any given date than in the very-volatile snowfall numbers. Similarly at "low elevations" in mountain regions throughout the western US (low being relative and specific to each mountain region), there is extreme year-to-year variability, with stable snowpacks and some degree of predictability only above certain threshold elevations.
At elevations below about 1500-2000 ft in the Washington Cascades, there is simply too much year-to-year variability in snowfall and snowpack to make any sense of the data. It is dominated by random variation and is not correlated or correlatable to anything, and is thus not useful for this purpose or most others. In addition, due to this extreme variability, snowfall and snowdepth data is not generally collected in these very low elevation areas, except in towns or other areas with established populations.
So that sets a lower limit on what we can analyze, which actually corresponds nicely to what skiers think of as "low-elevation" here, the lower limit of skiable terrain. Therefore we'll consider data from about 1500-3500 ft as low-elevation. Our low-elevation range thus includes Snoqualmie Pass (3000 ft) as it really must, while excluding all other Cascade Crest passes. In general, 3500-5500 ft would be considered mid-elevation for snowfall data in the Washington Cascades, while 5500-7000 ft are the highest elevations at which such data is available. The corresponding elevation bands in the Oregon Cascades are about 1000 ft higher, and 2000 ft higher in the California Cascades, although this analysis will be limited to the Washington Cascades only at this point (due to time constraints).
In the Cascades, year-to-year snowfall and snowpack variability increases substantially as one moves south along the nearly 800-mile length of the range from southwestern BC to northern California, and increases even more as one continues further south along the nearly 400-mile extension of the Sierra Nevada. These annual variations are fairly well-correlated to 2 major ocean-atmosphere cycles which affect sea-surface temperatures in the Pacific Ocean: the El Nino Southern Oscillation (ENSO), which has a timescale of a few years, and the Pacific Decadal Oscillation (PDO), with a timescale of a few decades. The ENSO cycle is very well studied and is definitely not periodic, nor is it predictable years in advance, and the PDO appears to share those 2 characteristics, although it is much less well studied. Its roughly 10-times longer timescale makes determining periodicity or predictability all but impossible given that barely a couple of PDO cycles have been observed over the past century of scientific data.
Snowfall and snowpack in the Cascades has a very strong positive correlation to the cool phase of ENSO (La Nina), a correlation which extends throughout the entire range from north to south and at all elevations, and even extends (more weakly positive) into the Sierra Nevada. In contrast, the warm phase of ENSO (El Nino) has much more complicated correlations, being very strongly positive for snowfall and snowpack (and precip) in the Sierra Nevada and California Cascades, but weakly negative for snowfall and snowpack in the Washington and Oregon Cascades (more strongly negative at low elevations), and again somewhat positive in southwestern BC especially at higher elevations. See my Cascade ENSO Snowfall webpage, which was created a decade ago and was the first comprehensive analysis of ENSO effects in the Cascades at elevations relevant for skiing and ski mountaineering, for more details about these correlations.
As for the PDO, I know of no similar study, but the correlations appear to be fairly obvious in this case, especially for the Cascades and southern BC: the cool phase of the PDO corresponds to 1-3 decade-long periods of generally well above-normal snowfall and snowpack (although some individual years may still end up well below-normal), while the warm phase brings 1-3 decade-long periods of generally below-normal snowfall and snowpack (although some individual years may still end up above-normal). Here is a plot of the monthly PDO index from 1900-2013 from the UW JISAO :
So the 1-3 decade-long periods of blue match up with 1-3 decade-long periods of above-normal snowfall, and vice-versa for the red (it's best to ignore the shorter variations and glitches in this monthly data, try to see the bigger smoothed picture). The 1930s and early 1940s were a terrible time period for Cascade snowfall, easily the worst in the historical record. That was followed by a long golden age of just under 3 decades, from the late 1940s through 1976, marked by numerous years of extremely high and record-setting snowfall, including at very low elevations in the 1950s. Then everything flipped in 1977 with one of the worst snow years ever on the entire West Coast, ushering in a 2-decade period of the dark ages, with mediocre to below normal snowfall most years and no huge snowfall years at all. The mid-90s saw the tide turn once again, cemented by the huge record-setting years of 1997 and 1999, followed by numerous other above-average years in the 2000s, including huge years in 2008 and 2011.
This multi-decadal PDO pattern is absolutely crucial to understanding any of this! Why? Let's say you're gonna do a big study of Northwest snowpack, and decide to run your data set from 1950-1997 as in the Mote papers which claimed to show huge declines in Northwest mountain snowpack (to find the papers, Google search for Mote snowpack). Thus your data starts in the midst of an extended period of above-normal snowfall years in the 1950s, and ends just after a long run of below-normal snowfall years in the 1980s and early 1990s, and then you fit a line to it -- obviously the line is going to slope downward, and make it look (erroneously!) as if the snowpack is decreasing precipitously over that period. The obvious flaw in their methodology is so mind-boggling and appalling, there's just nothing nice that can be said about their study. Badly done "science", and also pushing a pro climate-change agenda -- even though I happen to agree with the agenda, there's no way for any objective evaluation to agree with their flawed results. And worst of all, they had an easy fix: they could have only included data from sites which extended back to 1930 or earlier, leaving out the sites which only go back to 1950, which would have reduced their data set by a large amount -- but also made their false downward trend lines flatten out completely and moved their study closer to the realm of legitimate science, versus faulty conclusions drawn from a selectively cut data set.
What low-elevation snow data exists? And what does the data show?
Useful snowfall or snowpack data in the Cascades extends back for about one century, with data from Mount Rainier back to 1909 at Longmire (2760 ft) and to 1916 at Paradise (5430 ft). Paradise is absolutely the keystone site in any analysis of Cascade snowfall and snowpack, being one of the only 2 mid-high elevation sites in the entire Cascade Range with snowfall and snowdepth data extending back for over 90 years (Crater Lake Park HQ at 6470 ft in southern Oregon is the other) while also holding the honor of having the greatest average annual snowfall of any measurement site in the world (over 650") and the maximum snowfall ever recorded in a one-year period (over 1200" from February 1971 to 1972). For almost any question that I think of regarding snowfall and snowpack trends, the first site that I look at the data for is Paradise, followed by Crater Lake. It's really unfortunate how few such sites have good snowfall and snowdepth data over such a vast mountain range as the Cascades, as crucially important sites which really should have such data like Mount Baker Ski Area and Mount Hood Timberline, sadly do not have it or only have it for short periods.
But it's pretty much an easily-proven fact (and ought to be well-known by now) that Cascade snowpack at most mid-high elevation sites has actually not been decreasingly significantly (or even at all) over the past few decades -- disregarding highly misleading and erroneous papers like those mentioned above. So we won't worry about the mid-high elevation sites in this at all. What about data at low elevations, that's the real question here.
Even at low elevations of 1500-3500 ft as we are considering, and even looking for data that only extends back at least 50 years, there are less than a handful of sites in the Washington Cascades with reasonably complete snowfall and snowdepth data over that period: Longmire (2760 ft), Snoqualmie Pass (3000 ft), and Holden Village (3220 ft). Longmire and Snoqualmie have data back to 1909 and 1910, but the snowfall data is very incomplete with many missing months prior to 1930 at Snoqualmie. At Holden Village, the data prior to 1962 comes from a site listed as "Holden" with the same coordinates but elevation 200 ft higher, so the snowfall may not have been recorded at the same exact location. Here are plots of the snowfall data at these three sites with several running averages superimposed (data from WRCC , NCDC , and WSDOT Snoqualmie Historical Snowfall Records ):
For an interesting comparison with Longmire, here is the data from Paradise over the same time period (this plot added on 22Jan2015):
Although these 3 low-elevation sites are located at fairly similar elevations, they obviously receive vastly differing amounts of snowfall and precip. Holden Village is located in the North Cascades about 7 miles east of the Cascade Crest, with an average annual precip of only 40" to produce its 270+" average annual snowfall. Snoqualmie Pass is located at the lowest point on the Cascade Crest in Washington (outside the Columbia Gorge), with an average annual precip of 100" to produce its 420" average annual snowfall. Longmire is located on the southwest side of Mount Rainier about 7 miles from the summit, with an average annual precip of 80" to produce its 170" average annual snowfall. And for comparison, Paradise is on the south side of Mount Rainier about 5 miles from the summit, with an average annual precip of 110" to produce its 660+" average annual snowfall.
Despite these major climatological differences between the 3 low-elevation sites, they all have one thing in common: they do not show a significant reduction in snowfall in recent years! They all do show a sharp reduction in snowfall during the dark ages from 1977-1996, with much greater snowfalls prior to that.
[hr]Please see Reply #16 below for snowfall data at two more low-elevation sites analyzed 3 days after the initial study, Mazama (2170 ft) and Stehekin Company Creek powerhouse (1270 ft).
Continued in next post, exceeded 20,000 character limit . . .
Please Log in or Create an account to join the conversation.
- Amar Andalkar
-
Topic Author
- User
-
Less
More
- Posts: 635
- Thank you received: 0
11 years 6 months ago - 11 years 6 months ago #223540
by Amar Andalkar
Replied by Amar Andalkar on topic Re: Has low-elevation Cascade snowpack been declining?
Continued from previous post . . .
Snowfall data is hard to collect, since it requires a person to measure the new snowfall at least once a day (or clear the snow off of a 24-hour snow telemetry board), and so it is simply unavailable for any remote areas without year-round human occupation. In addition, even the best-quality mountain snowfall data is full of numerous errors, with an error rate typically in the ballpark of 1% of all daily observations based on my review of daily snowfall data from many many sites (most such errors are easily detected by finding inconsistencies between the snowfall for a given day and the change in snowdepth). Anyway, there's no way to fix that, the data is what it is from each site, and it must be understood to have significant random noise (perhaps 5-10%) in all monthly or annual snowfall totals.
Low-elevation snowpack data:
In contrast to collecting accurate annual snowfall data, getting accurate snowdepth and snowpack (snow-water) data is very easy. Manual snow courses have been in use in western states since 1910 (generally measured once a month, sometime near the first of the month, 3-6 months per year), with automated snow telemetry networks coming online in the 1970s and 1980s (primarily NRCS SNOTEL with now over 800 sites, but also state networks like California Cooperative Snow Surveys and avalanche centers such as NWAC). Unfortunately for our purposes here, there is a major problem: the period of record from SNOTEL and NWAC sites is too short to be of use, and in addition very few of these sites are located within our low-elevation band. The manual snow courses often have periods of record extending back 50 or 80 years, and also have larger numbers of them located in our low-elevation band, but are beset by an even more maddening problem: measuring manual snow courses takes costly human labor, so with the increasing numbers of SNOTEL sites since the 1980s, a large fraction of manual snow courses were discontinued, often after a few-year overlap period with a nearby newly installed SNOTEL site just long enough to develop a correlation sufficient for water-supply forecasting purposes. Unfortunately, such correlations are useless for our purposes (comparing snowpack at individual sites over a long period of record to see if it's declining) and in any case are unknown to the general public outside the water-supply forecasting offices.
There's no way to fix this issue either. But luckily, a few (very few!) snow courses in Washington have continued to be measured regularly throughout a lengthy period of record including recent years. And thankfully the new interactive map from the NRCS now makes it easy to view all active snow courses in Washington or any other state, a process which even a few months ago would have been prohibitively difficult. Note that the locations of some snow courses are totally wrong on the map, but most of them appear to be correct or close.
Out of 234 total snow courses in Washington listed in the NRCS database, only 84 are still active and being measured , only 49 of those have a period of record of over 40 years, and only 21 of those are at roughly 3500 ft or below in the Cascades:
[tt]
site_name start enddate latitude longitude elev county
Beaver Pass (21A01) 1944-March active 48.88 -121.26 3621 Whatcom
Marten Lake (21A09) 1959-February active 48.76 -121.72 3600 Whatcom
Granite Creek (20A06) 1971-February active 48.60 -120.81 3500 Skagit
Alpine Meadow (21B48) 1969-March active 47.78 -121.70 3500 Snohomish
Freezeout Cr. Tr. (20A01) 1944-March active 48.95 -120.93 3500 Whatcom
Bumping Lake New (21C36) 1961-January active 46.88 -121.28 3400 Yakima
Schreibers Meadow (21A10) 1959-February active 48.70 -121.82 3400 Whatcom
Mt. Gardner (21B21) 1959-March active 47.36 -121.57 3300 King
Fish Lake (21B04) 1943-January active 47.53 -121.09 3300 Kittitas
Ahtanum R.S. (21C11) 1941-January active 46.52 -121.02 3100 Yakima
Grass Mtn. No. 2 (21B27) 1961-January active 47.22 -121.76 2900 King
New Lake Hozomeen (21A30) 1971-February active 48.94 -121.03 2800 Whatcom
Tunnel Avenue (21B08) 1941-February active 47.32 -121.34 2433 Kittitas
Thunder Basin (20A07) 1948-January active 48.52 -120.99 2400 Skagit
City Cabin (21B03) 1948-March active 47.32 -121.52 2390 King
S.f. Thunder Creek (21A14) 1959-February active 48.58 -121.62 2200 Skagit
Beaver Creek Trail (21A04) 1944-March active 48.82 -121.19 2200 Whatcom
Dommerie Flats (21B14) 1939-March active 47.22 -121.05 2200 Kittitas
Rocky Creek (21A12) 1959-February active 48.68 -121.78 2100 Whatcom
Meadow Cabins (20A08) 1945-March active 48.58 -121.03 1900 Skagit
Chiwaukum G.S. (20B16) 1961-January active 47.69 -120.74 1810 Chelan
[/tt]
So let's look at the snowdepth and SWE as a % of normal (1981-2010 median) over the last 9 years 2006 to 2014 at these 21 sites (we all know that 2005 was far below normal, the worst snow year in 30-60 years, so let's cut it off there). Sites are arranged in geographic order from N and W to S and E along the Cascades, and those 9 seasons are very approximately categorized as above-near-below normal by glancing at the % of normal values:
East side of Mount Baker:
Marten Lake (21A09) 3600 ft (1959-2015)
Huge snowdepths almost comparable to Baker Ski Area, hardly feels like a low-elevation site!
All recent years 2014 & 2013 & 2012 & 2011 are above-normal, 2010 & 2009 near-normal, 2008 & 2007 & 2006 also above-normal
South side of Mount Baker:
Schreibers Meadow (21A10) 3400 ft (1959-2015)
2014 near-normal, 2013 & 2012 & 2011 above-normal, 2010 & 2009 near-normal, 2008 & 2007 & 2006 also above-normal
Rocky Creek (21A12) 2100 ft (1959-2015)
NOTE: 1971-2000 normals used since 1981-2010 are missing -- All recent years 2014 & 2013 & 2012 & 2011 are above-normal, 2010 below-normal, 2009 & 2008 & 2007 & 2006 also above-normal
East of Baker Lake & Lake Shannon:
S.f. Thunder Creek (21A14) 2200 ft (1959-2013)
NOTE: very spotty data in recent years, 1971-2000 normals used since 1981-2010 are missing
North Cascades NP: Big Beaver Creek
Beaver Pass (21A01) 3621 ft (1944-2015)
All recent years 2014 & 2013 & 2012 & 2011 are above-normal, 2010 & 2009 near-normal, 2008 & 2007 & 2006 also above-normal
Beaver Creek Trail (21A04) 2200 ft (1944-2015)
All recent years 2014 & 2013 & 2012 & 2011 are above-normal, 2010 below-normal, 2009 & 2008 & 2007 & 2006 also above-normal
North Cascades NP: East of Ross Lake
New Lake Hozomeen (21A30) 2800 ft (1971-2015)
2014 & 2012 & 2011 above-normal, 2013 & 2010 below-normal, 2009 & 2008 & 2007 & 2006 also above-normal
Freezeout Cr. Tr. (20A01) 3500 ft (1944-2015)
All recent years 2014 & 2013 & 2012 & 2011 are above-normal, 2010 below-normal, 2009 & 2008 & 2007 & 2006 also above-normal
North Cascades NP: Thunder Creek
Meadow Cabins (20A08) 1900 ft (1945-2015)
All recent years 2014 & 2013 & 2012 & 2011 are above-normal, 2010 below-normal, 2009 & 2008 & 2007 also above-normal, 2006 below-normal
Thunder Basin (20A07) 2400 ft (1948-2015)
2014 & 2012 & 2011 above-normal, 2013 near-normal, 2010 below-normal, 2009 near-normal, 2008 & 2007 above-normal, 2006 near-normal
North Cascades NP: SR 20
Granite Creek (20A06) 3500 ft (1971-2015)
All recent years 2014 & 2013 & 2012 & 2011 are above-normal, 2010 below-normal, 2009 & 2008 & 2007 & 2006 also above-normal
South of Gold Bar on US 2:
Alpine Meadow (21B48) 3500 ft (1969-2015)
All recent years 2014 & 2013 & 2012 & 2011 are above-normal, 2010 below-normal, 2009 & 2008 & 2007 & 2006 also above-normal
South of Lake Wenatchee on US 2:
Chiwaukum G.s. (20B16) 1810 ft (1961-2013)
2012 & 2011 above-normal, 2013 & 2010 below-normal, 2009 near-normal, 2008 & 2007 & 2006 also above-normal
Cle Elum River Road:
Fish Lake (21B04) 3300 ft (1943-2015)
2014 & 2012 & 2011 above-normal, 2013 & 2010 & 2007 near-normal, 2009 & 2008 & 2006 also above-normal
Cedar River south of I-90:
Mt. Gardner (21B21) 3300 ft (1959-2015)
2014 below-normal, 2013 & 2012 & 2011 above-normal, 2010 below-normal, 2009 & 2008 & 2007 & 2006 also above-normal
City Cabin (21B03) 2390 ft (1948-2015)
2014 & 2011 near-normal, 2013 & 2012 above-normal, 2010 below-normal, 2009 & 2008 & 2006 also above-normal, 2007 near-normal
East end of Keechelus Lake south of I-90:
Tunnel Avenue (21B08) 2433 ft (1941-2015)
2014 & 2013 near-normal, 2012 & 2011 above-normal, 2010 below-normal, 2009 & 2008 & 2007 & 2006 also above-normal
Near Cle Elum Lake north of I-90:
Dommerie Flats (21B14) 2200 ft (1939-2015)
2014 & 2013 above&below-normal, 2012 & 2011 above-normal, 2010 below-normal, 2009 & 2008 & 2007 & 2006 also above-normal
North of SR 410 east of Enumclaw:
Grass Mtn. No. 2 (21B27) 2900 ft (1961-2015)
Very spotty data since 2009, but 2009 & 2008 & 2007 & 2006 all above-normal
South of SR 410 east of Chinook Pass:
Bumping Lake New (21C36) 3400 ft (1961-2015)
2014 below-normal, 2013 & 2010 near-normal, 2012 & 2011 above-normal, 2009 & 2008 & 2007 & 2006 all above-normal
South of US 12 west of Yakima:
Ahtanum R.s. (21C11) 3100 ft (1941-2013)
2013 & 2012 & 2009 below-normal, 2011 above-normal, 2010 & 2008 & 2007 near-normal, 2006 above-normal
So basically, the story is roughly the same at almost all of these sites: the years from 2006-2014 have in general been above-normal for snowpack most years, with very few below-normal years, generally only 1 or 2 years at most sites. Although I didn't bother categorizing them (too much work), in general the years from 1977 to 1996 are much worse at all of these sites, with a majority of below-normal years during that 20 year period. The data is fairly conclusive and leaves little room for stating that recent years have had below normal snowpacks at low-elevation sites in the Washington Cascades.
And why was I expecting this result? Because simply put, the last nine years (from 2005-6 onward) have really been a great period for snowpack and snowfall in the Cascades, based on my personal experience and all the snow data that I track through the winter, spring, and summer each year. This is especially true in Washington, but clearly less so in southern Oregon and California which have suffered 3 straight drought years and possibly entering a fourth. This recent period has included 2 huge near-record-type years (2007-8 and 2010-11), along with several other above-average years, and there has not been a single year that has been well below-average overall for the Washington Cascades since 2004-5. The late-spring and summers of 2010, 2011, and 2012 were the best late-seasons for snowpack in the Cascades in almost 40 years. Then 2013 was a banner year for low-elevation powder even near Snoqualmie Pass (any season that I ski the Kendall Lakes basin area 7 times in deep powder has got to be a banner powder year, especially given my typical preference for skiing elsewhere!). And 2014 turned out to be near-normal or above-normal by any fair objective measure of snowpack, despite a very slow start, and personally was one of my best ski mountaineering seasons ever.
In my own personal experience, I'm just not seeing (or skiing) this bad, below-normal, rapidly declining snowpack -- not at all. I'm rather curious why so many skiers have such strongly held views that the last several years have been terrible overall or at least at low elevations, when hard data and my own impressions indicate strongly otherwise.
(I may revise and edit this post several times, since it is long and complicated, and minor errors may have slipped in too . . . please let me know if you find any. Plus I haven't slept at all overnight or in over 30 hours while working on this data retrieval and analysis.)
[hr]Please see Reply #16 below for a further extension of this analysis to include SNOTEL sites in the southernmost Washington Cascades, done 3 days after the initial study.
Please Log in or Create an account to join the conversation.
- GerryH
-
- User
-
Less
More
- Posts: 88
- Thank you received: 0
11 years 6 months ago #223544
by GerryH
Replied by GerryH on topic Re: Has low-elevation Cascade snowpack been declining?
Really fine work Amar. Thanks for so clearly showing these historical trends, particularly of the PDO. Looking at the maximums back in the 50's surely seems to support the Moffet's at Snoqualmie building those dangerously high top off-loading stations on those 1st generation chairlifts. It put real fear in your gut as a beginner, as your chair approached the top lift station, which itself was adorned with the broken ski tips of the unwary or distracted who innocently let their skis dangle
So now for another question: Can you analyze the data to show when enough skiable snow has accumulated, for however many stations you can find. How much variability is there in the onset of skiing? Or, is our 'typical' season still averaging the same mean start, center or overall period? Should we shift our expectations, or just cool it and be patient, knowing that the skiing will always return to the mean - which seems to fly in the face of global warming, which I too fear is well on its way.
So now for another question: Can you analyze the data to show when enough skiable snow has accumulated, for however many stations you can find. How much variability is there in the onset of skiing? Or, is our 'typical' season still averaging the same mean start, center or overall period? Should we shift our expectations, or just cool it and be patient, knowing that the skiing will always return to the mean - which seems to fly in the face of global warming, which I too fear is well on its way.
Please Log in or Create an account to join the conversation.
- Micah
-
- Moderator
-

Less
More
- Posts: 142
- Thank you received: 0
11 years 6 months ago #223548
by Micah
Replied by Micah on topic Re: Has low-elevation Cascade snowpack been declining?
Wow, Amar. I haven't had time to read and contemplate your post, but I wanted to express my gratitude. Thank you for doing this. I am curious about these kinds of questions, but I would never be able to collect, aggregate, and interpret enough historical data!
Please Log in or Create an account to join the conversation.
- Chamois
-
- User
-
Less
More
- Posts: 132
- Thank you received: 1
11 years 6 months ago #223549
by Chamois
Replied by Chamois on topic Re: Has low-elevation Cascade snowpack been declining?
Thanks Amar - very interesting read.
Maybe if we had more snow this year you would not have had time to prepare this!
Maybe if we had more snow this year you would not have had time to prepare this!
Please Log in or Create an account to join the conversation.
- rippy
-
- User
-
Less
More
- Posts: 89
- Thank you received: 1
11 years 6 months ago #223552
by rippy
Replied by rippy on topic Re: Has low-elevation Cascade snowpack been declining?
The data gathered and analyzed is very impressive Amar, thanks for delving into this. My observation is that some years in the latter 70's, 80's, early 90's were not as deep and long lasting but did afford skiing at our local areas. Sometimes pretty thin coverage, but adequate.....mostly. The 2005 event and this years stand out although 05 turned a corner late. One has to wonder when the warmest couple years of record show up (don't say this to a mid-westerner, they're getting the polar hammer) along with significant ice melt if the next, say 20 years a predictive approach could let us look into the crystal ball? I can imagine mean snow levels going upward, enough moisture in the storms to drop meaningful amounts of snow, but temp's will be just a few degrees off. Probably some forecasts thinking we'll dry a bit but I doubt there's hard evidence. The conjecture that Snoqualmie Pass will be lucky to pull off a ski season in 20 to 30 years is sounding more real though. In your research do you look at data modeling of longer-term projections? Maybe you've seen some of the "what-if" scenario's and what us armchair weatherpersons might notice should the weather influences go contrary? Just curious and again, very nice job!
Please Log in or Create an account to join the conversation.