- Posts: 166
- Thank you received: 0
Has low-elevation Cascade snowpack been declining?
- Koda
-

- User
-

Less
More
11 years 6 months ago #223572
by Koda
so if the snowpack is not declining are there any measurements to why the snowpack doesn’t seem to start to build up until mid/late January? Seems like in recent years we get late season storms that bring paramount amount of snow to balance out the annual snowfall late in the season. Perhaps without the early season low elevation snowpack these late season storms don’t have as much effect on the lower elevations which melt out sooner after the storm. This might be why some low elevation ski resorts seem to be opening later and closing sooner these days and also may validate some of our old memories of deep snowpacks years ago. If that makes sense in my non-scientific understanding!
Its like the snowpack isn’t declining but there is a change in the weather pattern….
Replied by Koda on topic Re: Has low-elevation Cascade snowpack been declining?
so if the snowpack is not declining are there any measurements to why the snowpack doesn’t seem to start to build up until mid/late January? Seems like in recent years we get late season storms that bring paramount amount of snow to balance out the annual snowfall late in the season. Perhaps without the early season low elevation snowpack these late season storms don’t have as much effect on the lower elevations which melt out sooner after the storm. This might be why some low elevation ski resorts seem to be opening later and closing sooner these days and also may validate some of our old memories of deep snowpacks years ago. If that makes sense in my non-scientific understanding!
Its like the snowpack isn’t declining but there is a change in the weather pattern….
Please Log in or Create an account to join the conversation.
- Micah
-
- Moderator
-

Less
More
- Posts: 142
- Thank you received: 0
11 years 6 months ago - 11 years 6 months ago #223575
by Micah
Replied by Micah on topic Re: Has low-elevation Cascade snowpack been declining?
Koda:
Here is a quick plot of the snow-water equivalent data from Schreibers Meadow that Amar links above for January and May (chosen near the beginning and end of the time that there is a reasonable amount of data).

I don't see any shift towards deeper snowpack in May relative to January. Actually, if I look closely, it seems like the Jan. numbers are pretty steady, but the May numbers tend to be below average from ~1976 to ~1996 when the PDO index was mostly positive and above average for dates in this dataset before then when the PDO index was mostly negative. Feel free to repeat this analysis for all the other data....
Here is a quick plot of the snow-water equivalent data from Schreibers Meadow that Amar links above for January and May (chosen near the beginning and end of the time that there is a reasonable amount of data).
I don't see any shift towards deeper snowpack in May relative to January. Actually, if I look closely, it seems like the Jan. numbers are pretty steady, but the May numbers tend to be below average from ~1976 to ~1996 when the PDO index was mostly positive and above average for dates in this dataset before then when the PDO index was mostly negative. Feel free to repeat this analysis for all the other data....
Please Log in or Create an account to join the conversation.
- lrudholm
-
- User
-
Less
More
- Posts: 83
- Thank you received: 0
11 years 6 months ago #223578
by lrudholm
Replied by lrudholm on topic Re: Has low-elevation Cascade snowpack been declining?
We're doomed!
Please Log in or Create an account to join the conversation.
- Koda
-
- User
-
Less
More
- Posts: 166
- Thank you received: 0
11 years 6 months ago #223579
by Koda
I see the dip in the May trend, but I also see a slight decline in the trend overall.
Replied by Koda on topic Re: Has low-elevation Cascade snowpack been declining?
I don't see any shift towards deeper snowpack in May relative to January. Actually, if I look closely, it seems like the Jan. numbers are pretty steady, but the May numbers tend to be below average from ~1976 to ~1996 when the PDO index was mostly positive and above average for dates in this dataset before then when the PDO index was mostly negative. Feel free to repeat this analysis for all the other data....
I see the dip in the May trend, but I also see a slight decline in the trend overall.
Please Log in or Create an account to join the conversation.
- Amar Andalkar
-
Topic Author
- User
-
Less
More
- Posts: 635
- Thank you received: 0
11 years 6 months ago - 11 years 6 months ago #223581
by Amar Andalkar
Replied by Amar Andalkar on topic Re: Has low-elevation Cascade snowpack been declining?
Continued from the original 2 posts above . . . written 3 days later, as I was out skiing in great snow conditions the past 2 days at Crystal (51,000 vert of sunny empty smooth grippy fast awesome groomers, such a blast at 50+ mph) and Camp Muir via Nisqually Chute (1-2" of silky smooth powder on a firm base on much of the Snowfield, then nice sun-softened proto-corn in the Chute).
For the sake of completeness, I decided to also check the data for relevant low-elevation SNOTEL sites in Washington, even though all were installed in 1978 or later and thus have less than the 40 year minimum period of record used for the snow course data above. So let's look at SNOTEL sites with at least 30 years of data, the bare minimum for addressing the central question of this thread (whether snowpack has been declining over the past 2-3 decades) and also the minimum for NRCS to calculate reliable values for normal snowpack and % of normal (they are currently using the 1981-2010 time frame). Note that relaxing the minimum required period from 40 to 30 years for the earlier analysis above would not have included any additional snow courses, as there are no active snow courses in the Cascades with less than 40 but more than 30 years of data.
This map shows all active snow courses and SNOTEL sites in Washington . There are 79 SNOTEL sites in Washington listed in the NRCS database, of which 75 are still active, only 32 of those have a period of record of over 30 years, and only 6 of those are at roughly 3500 ft or below in the Cascades (one of which at Fish Lake is located adjacent to the snow course listed above in Reply #1).
Low-elevation SNOTEL sites in Washington with at least 30 years of data:
[tt]
site_name start enddate latitude longitude elev county
Pope Ridge (699) 1980-September active 47.99 -120.57 3590 Chelan
Spirit Lake (777) 1983-October active 46.26 -122.18 3520 Skamania
June Lake (553) 1980-December active 46.15 -122.15 3440 Skamania
Fish Lake (478) 1980-September active 47.54 -121.09 3430 Kittitas
Spencer Meadow (776) 1981-February active 46.18 -121.93 3400 Skamania
Cougar Mountain (420) 1980-September active 47.28 -121.67 3200 King
[/tt]
Looking at that table, one major benefit of including these 6 SNOTEL sites becomes obvious: 3 of them are located in the southernmost Washington Cascades near Mount Saint Helens, well south of any of the snow courses included in this study (which were very disproportionately located in the North Cascades), so they provide an important check on whether these results are consistent throughout the entire Washington Cascades. Here is the same type of quick analysis as was done for the snow courses, but including precip and snow-water statistics since these are available for SNOTEL sites:
Entiat River Road, west of Lake Chelan:
Pope Ridge (699) 3590 ft (1981-2015, snowdepth installed 1997)
Average annual precip of 34", median maximum SWE of 17" near March 20
2014 & 2013 near-normal, 2012 above-normal, 2011 & 2010 near-normal, 2009 below-normal, 2008 & 2007 & 2006 above-normal
Cle Elum River Road:
Fish Lake (478) 3430 ft (1983-2015, snowdepth installed 2000)
Average annual precip of 63", median maximum SWE of 30" near April 1
2014 & 2013 near-normal, 2012 & 2011 above-normal, 2010 below-normal, 2009 near-normal, 2008 & 2007 & 2006 above-normal
Green River north of SR 410:
Cougar Mountain (420) 3200 ft (1981-2015, snowdepth installed 2002)
Average annual precip of 97", median maximum SWE of 16" near March 5
2014 below-normal, 2013 & 2012 & 2011 above-normal, 2010 below-normal, 2009 & 2008 & 2006 above-normal, 2007 near-normal
North side of Mount Saint Helens:
Spirit Lake (777) 3520 ft (1984-2015, snowdepth installed 2005)
Extremely low snowpack site with extreme variability, due to strong rain-shadowing from Saint Helens and a total lack of tree cover in the 1980 eruption zone, it has only about half the precip and 10-15% of the snowpack at June Lake on the south side (and much worse than that by April).
Average annual precip of 88", median maximum SWE of 5" near March 5
2014 below-normal, 2013 & 2012 & 2011 above-normal, 2010 below-normal, 2009 & 2008 & 2007 & 2006 also above-normal
South side of Mount Saint Helens:
June Lake (553) 3440 ft (1984-2015, snowdepth installed 2003)
Average annual precip of 165" (the most of any SNOTEL site as far as I know), median maximum SWE of 38" near March 5
2014 below-normal, 2013 & 2012 & 2011 above-normal, 2010 near-normal, 2009 & 2008 & 2007 & 2006 also above-normal
Between Mount Saint Helens and Mount Adams:
Spencer Meadow (776) 3400 ft (1982-2015, snowdepth installed 2006)
Average annual precip of 100", median maximum SWE of 30" near April 10
2014 below-normal, 2013 & 2012 & 2011 above-normal, 2010 near-normal, 2009 & 2008 & 2007 & 2006 also above-normal
So the results from the SNOTEL sites match those from the snow courses quite well. The years from 2006-2014 have in general been above-normal for snowpack most years, with very few below-normal years, generally only 1 or 2 years at most sites, and in general the years from 1981 to 1996 are much worse at all of these sites, with a majority of below-normal years during that period. Therefore the conclusions stated earlier can be safely extended to the southernmost Washington Cascades.
Also for the sake of completeness, I'm going to show snowfall data from a couple of other low-elevation sites, which did not meet the criteria for inclusion in the initial study (too short a period of record or too low in elevation).
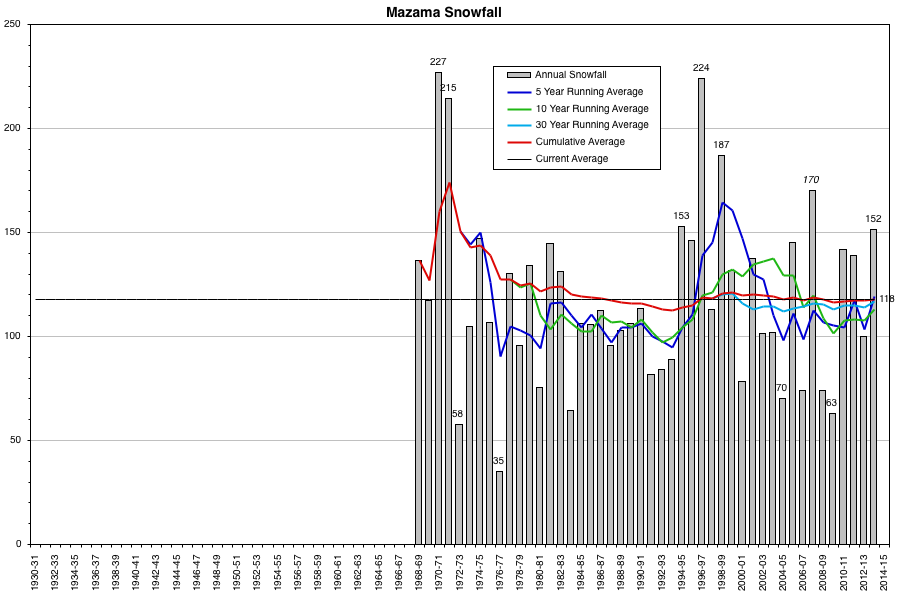
Reasonably high-quality snowfall data is available for Mazama (2170 ft) back to 1968-69, although unfortunately the huge 2007-8 season is missing completely, which artificially makes it look like recent averages were much lower than they actually are. It is likely that snowfall was close to 200" at Mazama that season based on correlations with Holden and Stehekin, while trying to add up data from the nearby Mazama NWAC site gives about 170", an inexact process which sets a minimum value for the snowfall that season. So I have inserted that value (the only estimated data added to any of this analysis!) so that the running averages are not erroneously skewed lower in recent years:
One site just below our elevation cutoff of 1500 ft also has fairly decent-quality snowfall data, a site listed as Stehekin 3 NW at WRCC or Stehekin 4 NW at NCDC . This site is located at the Company Creek powerhouse near 1270 ft about 4 miles NW of Stehekin itself, which is at the NW end of 50+ mile long Lake Chelan (view the location on the map at the NCDC link). Data at this site extends back to 1906, but as with Snoqualmie Pass, the snowfall data is very incomplete with many missing months prior to 1930. Also note that the exact location and elevation at which data has been recorded has shifted several times over the period of record (see Location History at the NCDC link), so the snowfall has definitely not been measured at the same place over the time period shown. So please take this data with a fairly large grain of salt, I am including it only because it is interesting and there are so few sites in the Cascades with any long-term snowfall data at all:
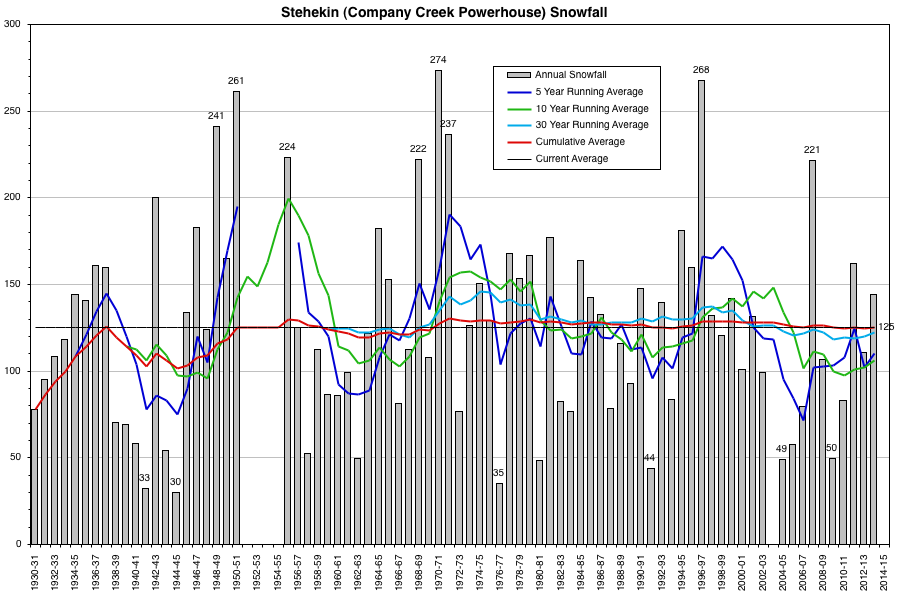
Interestingly, both of these sites have an average annual snowfall of about 120", but they are somewhat different climatologically despite both being located on the floor of deep glacial troughs on the east side of the North Cascades. Mazama is located 12 miles east of the Cascade Crest (Cutthroat Pass) and has an average annual precip of only 22" to produce its almost 120" average annual snowfall, while Stehekin Company Creek powerhouse is located 15 miles east of the Cascade Crest (Dome Peak area) but is nevertheless much farther west than Mazama (due to the Crest angling NE), and has an average annual precip of 34" to produce its 125" average annual snowfall. Annual snowfall at the two sites appears to be moderately well-correlated to each other, not unexpected given that they are located only 22 miles apart on the same side of the Cascades.
Overall, the snowfall data at these 2 sites shows roughly the same thing as Holden and the other 2 sites shown earlier in the original post, with no significant reduction in snowfall in recent years, and in fact greater snowfall recently compared to the 1977-1996 period. Those obsessed with the idea that snowfall must be decreasing at very low elevations in recent years may be able to find some (weak) ammunition to support their argument in the very noisy, extremely variable Stehekin data, however, the overall trend in that data since 1930 is certainly not negative.
[hr]
It's great to see others taking up the cause and doing their own analysis of the data!
Careful Koda, you're falling into the same trap as the Mote papers mentioned above: you're seeing a false downward trend because that data set starts during a period of historically great snowpack, the golden age from the late 1940s to 1976. If that data extended back to before 1930, the earliest years from the mid-1920s to the mid-1940s would instead look terrible, comparable to the 1977-1996 dip, and far worse than the years since 1997. And your downward trend line would flatten out completely!
[hr]I'll attempt to respond to various other questions and comments at some point over the next few days.
For the sake of completeness, I decided to also check the data for relevant low-elevation SNOTEL sites in Washington, even though all were installed in 1978 or later and thus have less than the 40 year minimum period of record used for the snow course data above. So let's look at SNOTEL sites with at least 30 years of data, the bare minimum for addressing the central question of this thread (whether snowpack has been declining over the past 2-3 decades) and also the minimum for NRCS to calculate reliable values for normal snowpack and % of normal (they are currently using the 1981-2010 time frame). Note that relaxing the minimum required period from 40 to 30 years for the earlier analysis above would not have included any additional snow courses, as there are no active snow courses in the Cascades with less than 40 but more than 30 years of data.
This map shows all active snow courses and SNOTEL sites in Washington . There are 79 SNOTEL sites in Washington listed in the NRCS database, of which 75 are still active, only 32 of those have a period of record of over 30 years, and only 6 of those are at roughly 3500 ft or below in the Cascades (one of which at Fish Lake is located adjacent to the snow course listed above in Reply #1).
Low-elevation SNOTEL sites in Washington with at least 30 years of data:
[tt]
site_name start enddate latitude longitude elev county
Pope Ridge (699) 1980-September active 47.99 -120.57 3590 Chelan
Spirit Lake (777) 1983-October active 46.26 -122.18 3520 Skamania
June Lake (553) 1980-December active 46.15 -122.15 3440 Skamania
Fish Lake (478) 1980-September active 47.54 -121.09 3430 Kittitas
Spencer Meadow (776) 1981-February active 46.18 -121.93 3400 Skamania
Cougar Mountain (420) 1980-September active 47.28 -121.67 3200 King
[/tt]
Looking at that table, one major benefit of including these 6 SNOTEL sites becomes obvious: 3 of them are located in the southernmost Washington Cascades near Mount Saint Helens, well south of any of the snow courses included in this study (which were very disproportionately located in the North Cascades), so they provide an important check on whether these results are consistent throughout the entire Washington Cascades. Here is the same type of quick analysis as was done for the snow courses, but including precip and snow-water statistics since these are available for SNOTEL sites:
Entiat River Road, west of Lake Chelan:
Pope Ridge (699) 3590 ft (1981-2015, snowdepth installed 1997)
Average annual precip of 34", median maximum SWE of 17" near March 20
2014 & 2013 near-normal, 2012 above-normal, 2011 & 2010 near-normal, 2009 below-normal, 2008 & 2007 & 2006 above-normal
Cle Elum River Road:
Fish Lake (478) 3430 ft (1983-2015, snowdepth installed 2000)
Average annual precip of 63", median maximum SWE of 30" near April 1
2014 & 2013 near-normal, 2012 & 2011 above-normal, 2010 below-normal, 2009 near-normal, 2008 & 2007 & 2006 above-normal
Green River north of SR 410:
Cougar Mountain (420) 3200 ft (1981-2015, snowdepth installed 2002)
Average annual precip of 97", median maximum SWE of 16" near March 5
2014 below-normal, 2013 & 2012 & 2011 above-normal, 2010 below-normal, 2009 & 2008 & 2006 above-normal, 2007 near-normal
North side of Mount Saint Helens:
Spirit Lake (777) 3520 ft (1984-2015, snowdepth installed 2005)
Extremely low snowpack site with extreme variability, due to strong rain-shadowing from Saint Helens and a total lack of tree cover in the 1980 eruption zone, it has only about half the precip and 10-15% of the snowpack at June Lake on the south side (and much worse than that by April).
Average annual precip of 88", median maximum SWE of 5" near March 5
2014 below-normal, 2013 & 2012 & 2011 above-normal, 2010 below-normal, 2009 & 2008 & 2007 & 2006 also above-normal
South side of Mount Saint Helens:
June Lake (553) 3440 ft (1984-2015, snowdepth installed 2003)
Average annual precip of 165" (the most of any SNOTEL site as far as I know), median maximum SWE of 38" near March 5
2014 below-normal, 2013 & 2012 & 2011 above-normal, 2010 near-normal, 2009 & 2008 & 2007 & 2006 also above-normal
Between Mount Saint Helens and Mount Adams:
Spencer Meadow (776) 3400 ft (1982-2015, snowdepth installed 2006)
Average annual precip of 100", median maximum SWE of 30" near April 10
2014 below-normal, 2013 & 2012 & 2011 above-normal, 2010 near-normal, 2009 & 2008 & 2007 & 2006 also above-normal
So the results from the SNOTEL sites match those from the snow courses quite well. The years from 2006-2014 have in general been above-normal for snowpack most years, with very few below-normal years, generally only 1 or 2 years at most sites, and in general the years from 1981 to 1996 are much worse at all of these sites, with a majority of below-normal years during that period. Therefore the conclusions stated earlier can be safely extended to the southernmost Washington Cascades.
Also for the sake of completeness, I'm going to show snowfall data from a couple of other low-elevation sites, which did not meet the criteria for inclusion in the initial study (too short a period of record or too low in elevation).
Reasonably high-quality snowfall data is available for Mazama (2170 ft) back to 1968-69, although unfortunately the huge 2007-8 season is missing completely, which artificially makes it look like recent averages were much lower than they actually are. It is likely that snowfall was close to 200" at Mazama that season based on correlations with Holden and Stehekin, while trying to add up data from the nearby Mazama NWAC site gives about 170", an inexact process which sets a minimum value for the snowfall that season. So I have inserted that value (the only estimated data added to any of this analysis!) so that the running averages are not erroneously skewed lower in recent years:
One site just below our elevation cutoff of 1500 ft also has fairly decent-quality snowfall data, a site listed as Stehekin 3 NW at WRCC or Stehekin 4 NW at NCDC . This site is located at the Company Creek powerhouse near 1270 ft about 4 miles NW of Stehekin itself, which is at the NW end of 50+ mile long Lake Chelan (view the location on the map at the NCDC link). Data at this site extends back to 1906, but as with Snoqualmie Pass, the snowfall data is very incomplete with many missing months prior to 1930. Also note that the exact location and elevation at which data has been recorded has shifted several times over the period of record (see Location History at the NCDC link), so the snowfall has definitely not been measured at the same place over the time period shown. So please take this data with a fairly large grain of salt, I am including it only because it is interesting and there are so few sites in the Cascades with any long-term snowfall data at all:
Interestingly, both of these sites have an average annual snowfall of about 120", but they are somewhat different climatologically despite both being located on the floor of deep glacial troughs on the east side of the North Cascades. Mazama is located 12 miles east of the Cascade Crest (Cutthroat Pass) and has an average annual precip of only 22" to produce its almost 120" average annual snowfall, while Stehekin Company Creek powerhouse is located 15 miles east of the Cascade Crest (Dome Peak area) but is nevertheless much farther west than Mazama (due to the Crest angling NE), and has an average annual precip of 34" to produce its 125" average annual snowfall. Annual snowfall at the two sites appears to be moderately well-correlated to each other, not unexpected given that they are located only 22 miles apart on the same side of the Cascades.
Overall, the snowfall data at these 2 sites shows roughly the same thing as Holden and the other 2 sites shown earlier in the original post, with no significant reduction in snowfall in recent years, and in fact greater snowfall recently compared to the 1977-1996 period. Those obsessed with the idea that snowfall must be decreasing at very low elevations in recent years may be able to find some (weak) ammunition to support their argument in the very noisy, extremely variable Stehekin data, however, the overall trend in that data since 1930 is certainly not negative.
[hr]
Here is a quick plot of the snow-water equivalent data from Schreibers Meadow that Amar links above for January and May (chosen near the beginning and end of the time that there is a reasonable amount of data).
I don't see any shift towards deeper snowpack in May relative to January. Actually, if I look closely, it seems like the Jan. numbers are pretty steady, but the May numbers tend to be below average from ~1976 to ~1996 when the PDO index was mostly positive and above average for dates in this dataset before then when the PDO index was mostly negative. Feel free to repeat this analysis for all the other data....
It's great to see others taking up the cause and doing their own analysis of the data!
I see the dip in the May trend, but I also see a slight decline in the trend overall.
Careful Koda, you're falling into the same trap as the Mote papers mentioned above: you're seeing a false downward trend because that data set starts during a period of historically great snowpack, the golden age from the late 1940s to 1976. If that data extended back to before 1930, the earliest years from the mid-1920s to the mid-1940s would instead look terrible, comparable to the 1977-1996 dip, and far worse than the years since 1997. And your downward trend line would flatten out completely!
[hr]I'll attempt to respond to various other questions and comments at some point over the next few days.
Please Log in or Create an account to join the conversation.
- Koda
-
- User
-
Less
More
- Posts: 166
- Thank you received: 0
11 years 6 months ago #223584
by Koda
Replied by Koda on topic Re: Has low-elevation Cascade snowpack been declining?
Good info Amar, so my guess is these relic memories of deep snowpack years stemmed from the 70’s roughly 2-4 generations ago. Coincidentally, isn’t that also the time when alpine bindings became mainstream? What Im getting at here is banner snow years plus huge technological ski development = a surge in snow sports and lasting fond memories that carried through into the 80’s where many gen-xers learned to ski.
Please Log in or Create an account to join the conversation.