- Posts: 635
- Thank you received: 0
HUGE storm cycle brings 4-14 ft snow Feb6-25,2014!
- Amar Andalkar
-
 Topic Author
- User
-

Less
More
12 years 4 months ago - 12 years 4 months ago #220419
by Amar Andalkar
Replied by Amar Andalkar on topic Re: HUGE storm cycle brings 4-12 ft snow Feb6-21,2014!
I've had no trouble viewing the UW model forecasts in Chrome (although I usually view them in Safari), but that's on a Mac. Not sure what the problem could be.
[hr]No 216-hour update yesterday, too tired after Vertfest (= Powderfest, with 5" new between 10am and 3pm) even though I didn't race, demoing 6 different pairs of skis and trying to shoot photos of the race in a raging snowstorm. Clear skies at Alpental at 8am, very light snow falling by the 10am race start, snowing heavily by 10:30am.
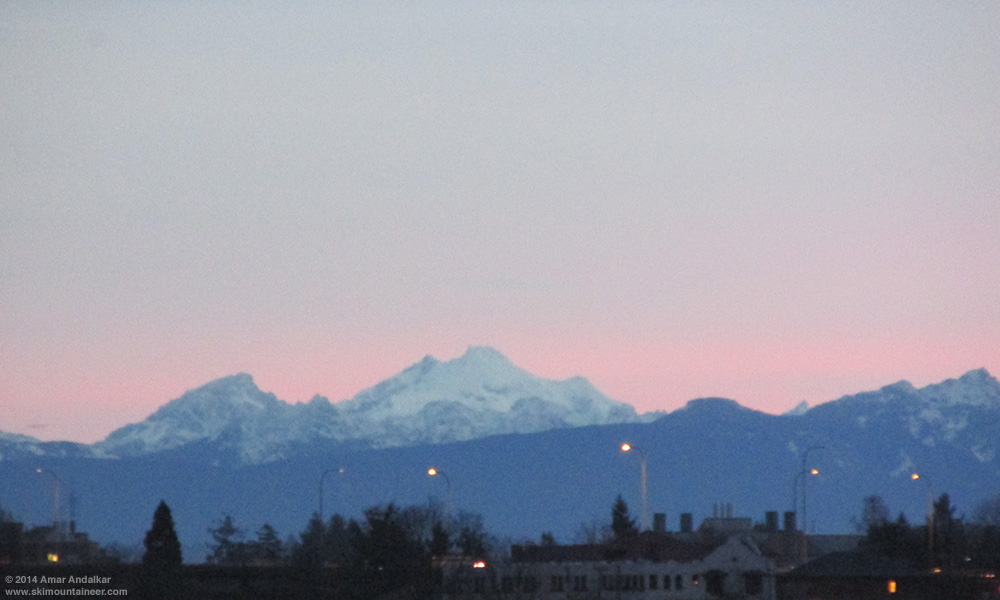
[size=small]Clear skies at dawn on Glacier Peak during a brief lull between storm systems, as seen from my deck in Seattle, 6:55am February 15.[/size]
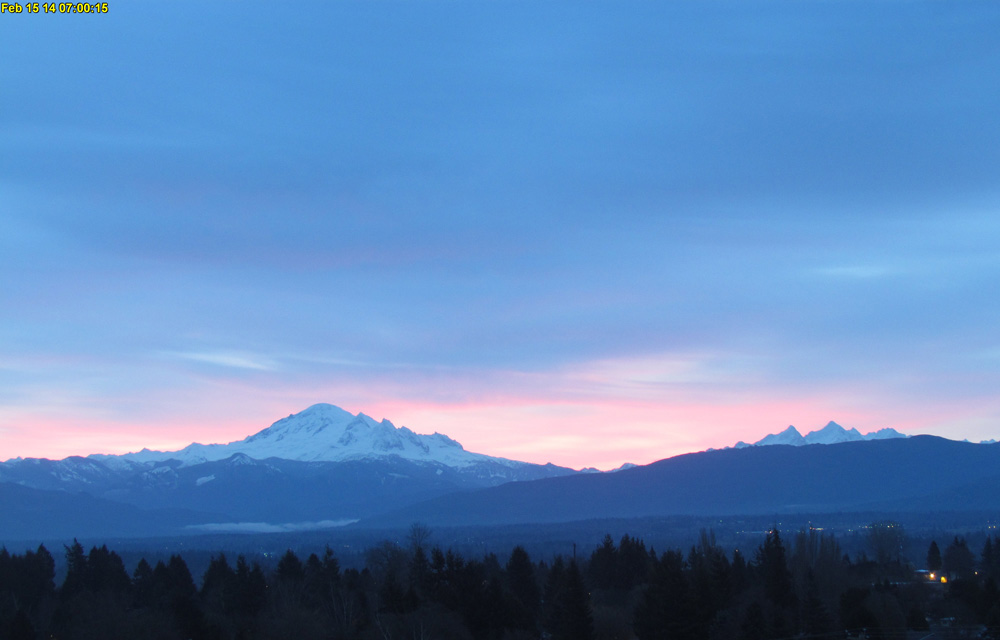
[size=small]Clear skies at dawn on Mount Baker and Twin Sisters Mountain during a brief lull between storm systems, as seen on the visibility camera from Ferndale .[/size]
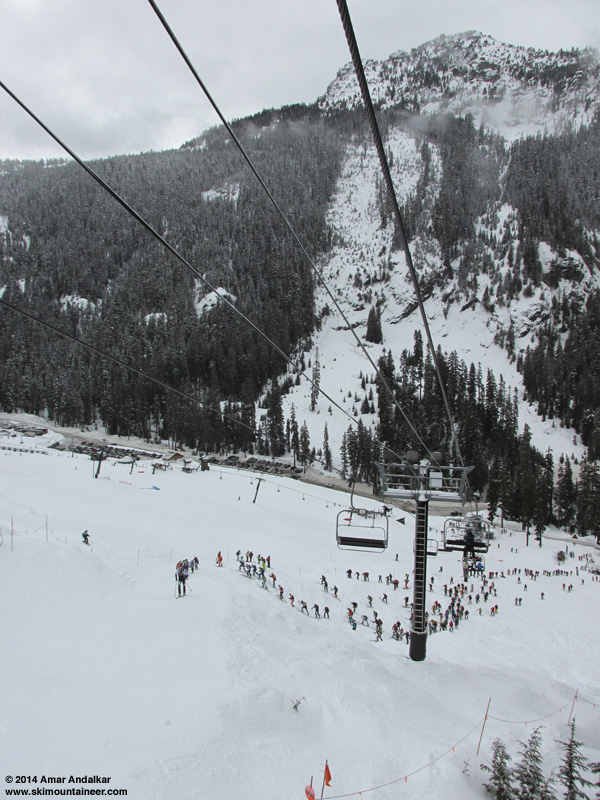
[size=small]Rando racers surging uphill from the start with Mount Snoqualmie still fully visible, Alpental Vertfest, 10:05am February 15.[/size]
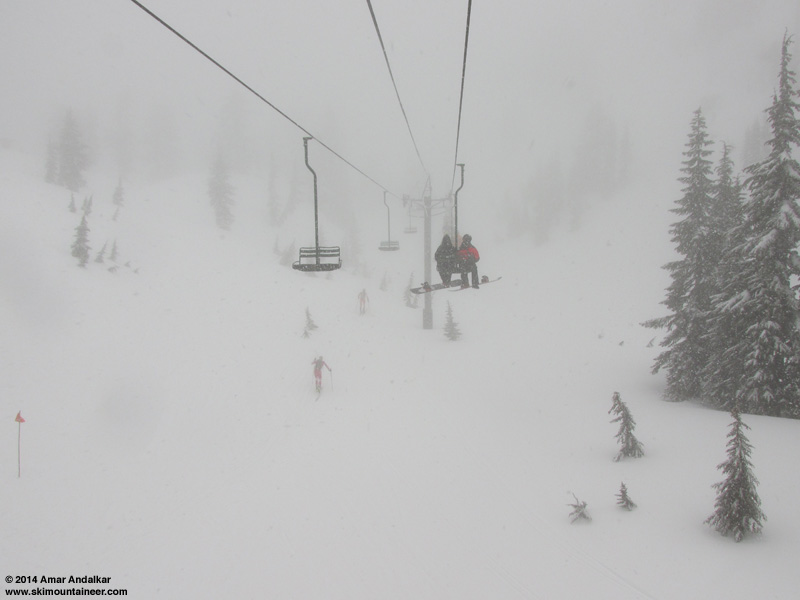
[size=small]Rando racers in a raging snowstorm, Alpental Vertfest, 10:35am February 15.[/size]
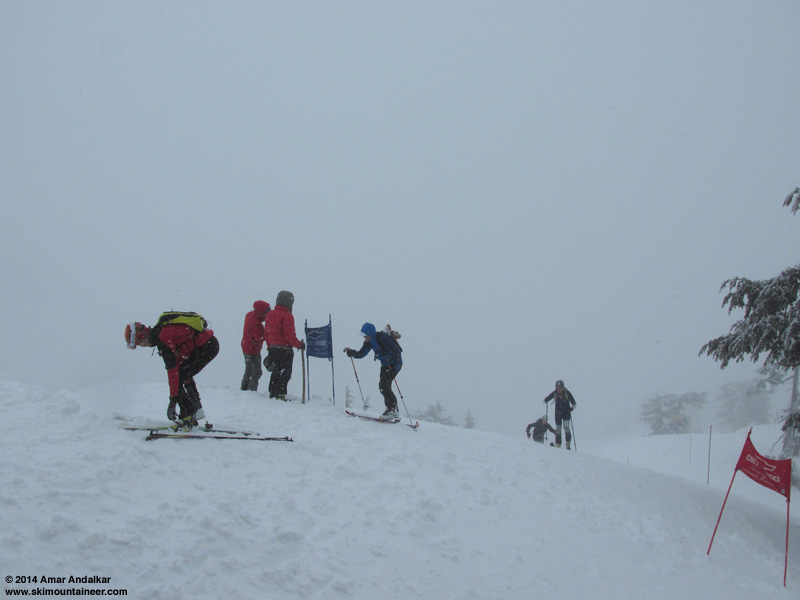
[size=small]The summit transition point with wind-driven horizontal snowfall, Alpental Vertfest, 10:50am February 15.[/size]
Snowfall data for February 15 at numerous ski areas was collected during the early morning and evening hours though, and the day's runs of the UW weather model were reviewed. Update #9 is in preparation, to be posted shortly...
[hr]No 216-hour update yesterday, too tired after Vertfest (= Powderfest, with 5" new between 10am and 3pm) even though I didn't race, demoing 6 different pairs of skis and trying to shoot photos of the race in a raging snowstorm. Clear skies at Alpental at 8am, very light snow falling by the 10am race start, snowing heavily by 10:30am.
[size=small]Clear skies at dawn on Glacier Peak during a brief lull between storm systems, as seen from my deck in Seattle, 6:55am February 15.[/size]
[size=small]Clear skies at dawn on Mount Baker and Twin Sisters Mountain during a brief lull between storm systems, as seen on the visibility camera from Ferndale .[/size]
[size=small]Rando racers surging uphill from the start with Mount Snoqualmie still fully visible, Alpental Vertfest, 10:05am February 15.[/size]
[size=small]Rando racers in a raging snowstorm, Alpental Vertfest, 10:35am February 15.[/size]
[size=small]The summit transition point with wind-driven horizontal snowfall, Alpental Vertfest, 10:50am February 15.[/size]
Snowfall data for February 15 at numerous ski areas was collected during the early morning and evening hours though, and the day's runs of the UW weather model were reviewed. Update #9 is in preparation, to be posted shortly...
Please Log in or Create an account to join the conversation.
- Amar Andalkar
-
Topic Author
- User
-
Less
More
- Posts: 635
- Thank you received: 0
12 years 4 months ago - 12 years 4 months ago #220427
by Amar Andalkar
Replied by Amar Andalkar on topic Re: HUGE storm cycle brings 4-12 ft snow Feb6-21,2014!
Update #9: 240 hours after initial post, 2-8 ft of snow has already fallen in southwest BC, Washington, Oregon, and California,
with an additional 4-8 ft predicted during this week for WA, OR, and southwest BC!
The climax of this storm cycle has arrived in the Pacific Northwest! The period of maximum sustained snowfall for Washington and Oregon is expected to extend from Sunday through Thursday, with several feet of new powder at further lowering snow levels. Epic!
Two days after the previous update, 4 more subsequent runs of the UW WRF-GFS model at 12-hour intervals continue to predict large snowfall amounts of 4-8 ft over the rest of this week for Washington, Oregon, and southwest BC. This is in addition to 2-8 ft of snow which has already fallen over the past 10 days since this storm cycle began on February 6 at most mountain sites from Bella Coola, BC, south to Mammoth Mountain, CA, plus parts of south-central and southeastern Alaska. New snow of at least a few inches (including up to 12-18" in the North Cascades, Olympics, and southwestern BC) was recorded over the past 24 hours at almost all mountain measurement sites along the Pacific coast from Alyeska near Anchorage, Alaska, all the way south to Mammoth Mountain, a span of about 2100 miles as the crow flies (and over 3100 miles by car ). The snowfall over this vast distance is all due to low-pressure systems spawned from the same upper-level parent low in the Gulf of Alaska which has been associated with this entire storm cycle.
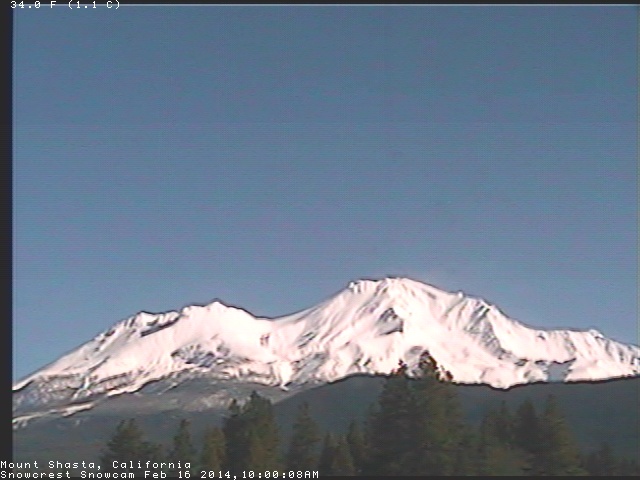
[size=small]Mount Shasta gleaming white on Sunday morning after a few inches of snow overnight, as seen on the SnowCrest webcam .[/size]
The predicted amounts for both precip and snowfall during this week remain similar to those predicted during the last several days, an excellent sign of stability in the model's predictions, with a continuing increase in overall storm totals as further storm systems came into view this weekend and into next week. If these predictions verify and the storm cycle continues as expected for the rest of this week, this will end up solidly in the HUGE storm cycle category with 15-day snowfall totals exceeding 10-12 ft at many sites especially above 4000-5000 ft in the Washington and northern Oregon Cascades plus southwestern BC.
The NWS's GFS model and their Quantitative Precipitation Forecasts still show up to 7-10" of precip over the next week for the mountains of Washington, with 4-5" in southwestern BC and Oregon, and much smaller amounts of only a fraction of an inch extending south into the California Cascades and northern Sierra. Here is total precipitation in inches predicted over the next 7 days through Sunday morning, February 23, with almost all of that shown in the Pacific Northwest falling in the next 5 days though Friday:
The fire hose of the jet stream (see Days 1-5 Jet Stream Analysis & Forecasts ) continues to be aimed directly into the Pacific Northwest, but as predicted it has undergone a major evolution and shift in direction on Saturday February 15, from southwesterly in the latter half of last week to westerly as of Sunday morning (compare with the same image in Update #7 above, this image is almost identical to the prediction 3 days earlier):
By Wednesday the jet stream pattern will further evolve, now approaching from the northwest, and remain that way through Friday, February 21, as it weakens and shifts eastward over the Northwest coast, bringing the heavy precip and snowfall (and this storm cycle) to an end:
Following Saturday's storm systems which brought snow from Alaska to California, there was a minor lull early Sunday with snowfall decreasing over the entire span and skies clearing completely in California. But the next much stronger system moved ashore immediately by midday aimed at Vancouver Island and the Olympics, pushing on to the southwestern BC mainland and Washington Cascades by Sunday afternoon. The heaviest snowfall rates are expected during Sunday evening into early Monday, with 2-4" per hour possible at times. The heaviest snowfall will shift south into the Oregon Cascades during the day Monday, but snow will continue in Washington throughout the day. The next strong system is expected to arrive on Tuesday morning, once again aimed at southwestern BC and Washington, then shifting southward to Oregon by the afternoon and even into northern California overnight. Another weaker wave of snowfall comes ashore on Wednesday morning, then the next strong system is projected to arrive late Wednesday into southwestern BC and Washington again, lasting through the day Thursday with snowfall again shifting into Oregon.
Snowfall during the next 3 days through 4am Wednesday is predicted to be 3-7 ft over the west slopes and volcanic peaks of the Washington and northern Oregon Cascades, the Olympics, and southwestern BC, with 2-4 ft in the southern Oregon Cascades and perhaps up to 1 ft extending into the California Cascades, Trinity Alps, and northern Sierra Nevada on Tuesday-Wednesday:
Higher resolution version of that, showing the Pacific Northwest and also zoomed in on Washington and Oregon:
Maximum snowfall amounts of 4-7 ft (marked by white inside yellow) are shown along the west slopes and volcanic peaks of the Washington and northern Oregon Cascades plus the Olympics. Notably, the Washington graphic above has the largest area with 3-day totals over 4 ft shown in any 3-day graphic in any previous update in this thread (slightly greater than that in Update #") , or either of the two earlier storm threads. So this is expected to be the largest 3-day snowfall in Washington state thus far in the 2013-14 season. The most intense portion of that is Sunday afternoon through Monday afternoon, when even the 24-hour totals are predicted to exceed 4 ft on Mount Rainier above about 5000 ft, with amounts exceeding 3 ft on most of the west slopes and volcanic peaks of the Washington Cascades and Olympics:
, or either of the two earlier storm threads. So this is expected to be the largest 3-day snowfall in Washington state thus far in the 2013-14 season. The most intense portion of that is Sunday afternoon through Monday afternoon, when even the 24-hour totals are predicted to exceed 4 ft on Mount Rainier above about 5000 ft, with amounts exceeding 3 ft on most of the west slopes and volcanic peaks of the Washington Cascades and Olympics:
It will be very interesting to see if such an extreme snowfall prediction actually verifies, especially since the model has given very similar predictions over the past 2 days, with only a minor reduction in predicted amounts and a slight shift in timing by several hours later. The UW model has become very good over the past several years of development, but extreme predictions often tend not to actually occur, and real 24-hour snowfall amounts may end up in the more reasonable 2-3 ft range.
The maximum snowfall rates predicted by the model are also amazing, with 4-5" per hour during the most intense portion of the storm at some locations. This image zoomed in on western Washington shows snowfall during a 3-hour period early Monday, with 12-16" predicted on Mount Rainier during those 3 hours:
This loop shows how the model predictions for snowfall during the 3-day period through 4am Wednesday have evolved between 10 subsequent runs over the last 5 days, the D(model)/D(t). Very consistent in the overall picture throughout with snowfall amounts increasing and decreasing a bit in BC and Oregon (remaining steadiest for Washington), but no major changes other than a significant reduction in snowfall for northern California:
www.atmos.washington.edu/~ovens/wxloop.c...2+v2014021912///+-st
Additional snowfall during the subsequent 3 days ending 4am next Saturday is predicted to be another 2-3 ft over the west slopes and volcanic peaks of the Washington and northern Oregon Cascades, with 1-2 ft in the Olympics, southwestern BC, and southern Oregon Cascades. Almost all of this snowfall is expected to occur before Friday morning:
It appears almost certain now that this storm cycle will finally dissipate and come to an end by Friday, February 21. But unlike after the first major storm cycle of the 2013-14 season (January 7-14, 2014) , there are no indications of a sustained period of high pressure and fair weather over the entire West Coast after this much-larger storm cycle. The extended GFS model out to 384 hours (16 days) shows additional weaker storm systems during the 6-16 day period into the start of March. This is the predicted 24-hour precip throughout that period, click "Loop All" to see all the graphics (3 hour intervals up to 192 hours, 12 hour intervals beyond that):
GFS, North Pacific, 02/16/2014 18UTC, precip_p24
Storm Cycle History:
The first stage of this storm cycle, aimed primarily at the Sierra Nevada (an atmospheric river) and also at Oregon and southern Washington (frontal snowfall along the boundary between a modified Arctic air mass and warmer air to the south), began early on Thursday, February 6, and ended during the day Monday, February 10. This atmospheric river event produced 4-day precipitation totals of up to 10-17" at many sites near Lake Oroville and Lake Tahoe along the west slopes of the northern Sierra Nevada, with snowfall totals reaching 5-7 ft at sites above 8000 ft from Independence Lake south to Sonora Pass with much lesser amounts of 1-2 ft at 6000 ft. Areas farther south such as Yosemite and Mammoth received much less snowfall, only about 2-3 ft even at 9000 ft, and only 2" total at 9000 ft on June Mountain located just north of Mammoth in the rain shadow of the Sierra Crest. Farther north in the northernmost Sierra Nevada, Trinity Alps, and California Cascades, maximum snowfall amounts were generally 1-3 ft above 6000-7000 ft. The frontal snowfall produced 2-3 ft in the Oregon and southern Washington Cascades, with lesser amounts of about 1 ft as far north as Stevens Pass, barely a few inches in the North Cascades, and almost nothing in southwestern BC which remained cold, clear, and dry. Extensive lowland snowfall down to sea level was also produced during this stage, from the southern Willamette Valley in Oregon all the way north past Seattle and Everett, with maximum amounts of over 6" in parts of northwest Oregon and southwest Washington.
The second stage of this storm cycle had already started as the first was ending on Monday morning February 10, and it extended throughout this week to Sunday, February 16, featuring a series of fronts and systems every 1-2 days in strong southwesterly flow over the north Pacific, aimed primarily at Oregon, Washington, and southwestern British Columbia. The first system of the second stage came ashore Monday morning, and the next much stronger system arrived in the same region on Tuesday afternoon, including another atmospheric river event aimed at Oregon, a few hundred miles farther north than the first atmospheric river aimed at the central Sierra Nevada. This atmospheric river stayed in place through Sunday as it weakened and shifted southward into northern California, bringing some more precipitation to that area over the weekend, before it finally faded away Sunday afternoon. This event produced very high precipitation amounts exceeding 13" on Mount Hood over the last 6 days. Additional snowfall amounts during this stage in the mountains of Oregon, Washington, and southwestern British Columbia were in the 2-5 ft range, with the largest amounts in the northern Oregon Cascades from Mount Hood to Mount Bachelor, which continues to have the largest storm total snowfall of any measurement site in the Northwest with over 7 ft at its 6300 ft base and almost 8 ft at its 7300 ft midstation as of Sunday morning. Given the excessive precip amounts on Mount Hood (about 17" total since February 6), storm total snowfall above 7000 ft likely exceeds 10 ft there already, with about 6.5 ft actually measured at Timberline Lodge (5900 ft) and 5.5 ft at Mount Hood Meadows (5400 ft).
The third and final stage of this storm cycle is underway as of Sunday February 16, following the shift of the jet stream from the southwesterly flow of last week to westerly as of Sunday morning, and eventually to northwesterly by midweek. Strong frontal systems are expected to continue to arrive every 1-2 days through Thursday, before the storm cycle fades out by Friday morning, February 21.
See the table in Reply #21 earlier in this thread for more complete snow and precip totals over the February 6-13 period at more than 170 measurement sites from southwestern BC to the southern Sierra Nevada. An updated table will be posted at some point later this week.
[hr]So how is the snowpack doing now in the Northwest? Here are the NWAC CLISNO reports for February 1 and February 15 (just released this morning):
[tt]
CLIMATOLOGICAL SNOWDEPTH INFORMATION
NORTHWEST WEATHER AND AVALANCHE CENTER SEATTLE WASHINGTON
DAY 1 MONTH 2 YEAR 2014
DATA IN INCHES, -99 DENOTES MISSING DATA
CURRENT CLIMATE PER CENT LAST THRU 2013 THRU 2013
DEPTH AVERAGE OF NORMAL YEAR MAX/YEAR MIN/YEAR
HURRICANE 32 79 41 94 162/1999 10/2005
MT BAKER 82 124 66 153 234/1933 17/1981
STEVENS 61 87 70 88 152/1964 10/1981
SNOQUALMIE 44 78 56 74 154/1964 8/1977
STAMPEDE 40 85 47 -99 228/1946 0/2005
MISSION 22 39 56 36 67/2006 8/1976
CRYSTAL 26 59 44 63 112/1999 6/1977
PARADISE 104 132 79 150 240/1969 27/1977
WHITE PASS 25 53 47 46 110/2008 0/2005
TIMBERLINE 75 119 63 126 238/2002 10/1977
MEADOWS 57 98 58 99 184/1974 9/1977
CLIMATOLOGICAL SNOWDEPTH INFORMATION
NORTHWEST WEATHER AND AVALANCHE CENTER SEATTLE WASHINGTON
DAY 15 MONTH 2 YEAR 2014
DATA IN INCHES, -99 DENOTES MISSING DATA
CURRENT CLIMATE PER CENT LAST THRU 2013 THRU 2013
DEPTH AVERAGE OF NORMAL YEAR MAX/YEAR MIN/YEAR
HURRICANE 44 88 50 100 198/1999 17/2005
MT BAKER 107 138 78 161 244/1999 24/1977
STEVENS 80 94 85 86 166/1956 16/1977
SNOQUALMIE 61 85 72 66 168/1949 4/1977
STAMPEDE 53 90 59 63 202/1949 0/1977
MISSION 38 42 90 35 71/1999 9/1976
CRYSTAL 44 61 72 70 117/1999 0/1977
PARADISE 121 143 85 144 264/1972 24/1977
WHITE PASS 41 55 75 46 100/1999 0/1977
TIMBERLINE 101 128 79 122 230/2002 8/1977
MEADOWS 86 106 81 93 187/1974 4/1977
THIS TABLE PRODUCED ON THE 1ST AND 15TH BETWEEN 15 NOVEMBER AND 1 MAY.
AVERAGES, MAXIMUMS AND MINIMUMS EARLY AND LATE IN THE SEASON MAY BE INACCURATE DUE TO LIMITED DATA.
IF THERE IS TIE FOR THE MAXIMUM OR MINIMUM SNOW DEPTH THEN THE LATEST YEAR IS INDICATED.
RECORDS BEGIN: HURRICANE 1979, MT BAKER 1926, STEVENS 1939, SNOQUALMIE 1929, STAMPEDE 1943,
MISSION RIDGE 1970, CRYSTAL 1967, PARADISE 1926, WHITE PASS 1976, TIMBERLINE 1973, MT HOOD MEADOWS 1974.
NOTE: NRCS DATA USED AT STAMPEDE STARTING 2006-2007 SEASON.
[/tt]
Already a significant improvement in snowpack at all sites as of February 15, and the really heavy snowfall hadn't even begun yet over this region by then, so these numbers are already missing another 4-16" increase in snowdepths since yesterday morning. As of Sunday February 16, Hurricane Ridge is up to 62", Mt Baker 121", Stevens 90", Snoqualmie 65", Stampede 58", Mission Ridge 41", Crystal 50", Paradise 130", White Pass 50", Timberline 110", and Meadows 92" -- over 90% of normal at several sites already! By the time this storm cycle ends on Friday February 21, snowdepths will likely be over 100% of normal at all of these sites, and some sites are likely to be 120-150% of normal for that date. When the next NWAC CLISNO report comes out 8 days after that on March 1, most sites should still be near or above normal even without significant additional snowfall during the last week of February.
Several other sites not included in the NWAC report are already over 100% of normal, including Mount Bachelor which has 105" at its 6300 ft base (roughly 110% of normal) and 130" at its 7300 ft midstation as of Sunday morning. The Chilliwack River BCRFC site at 5300 ft in the BC Cascades (just north of the US border near Mount Baker) reached 138" as of Sunday morning, and is at roughly 120% of normal for snowdepth and snow water equivalent. The Brown Top SNOTEL site (5800 ft near Mount Redoubt in the North Cascades) reached 126" today and might be above 100% of normal too, except it was only installed in 2009 and so normal values are not yet established.
I really do love it when all the gloom-and-doom whiners, those complaining about how bad the early-season snowpack is and how that means the season will be a total bust, turn out to be utterly and completely wrong. At least in Washington, northern Oregon, and southwestern BC, it appears certain that they will be wrong very shortly, and the entire season will be saved and set to go, with a substantial snowpack deep enough to last through spring as usual. Unfortunately there is no such hope on the horizon yet for the far southern end of the Cascades in southernmost Oregon and northernmost California, where the snowpack situation remains bleak at barely 10-25% of normal even after a couple feet of snowfall during the first days of this storm cycle. Hopefully the next major storm cycle will be aimed directly at this most desperately drought-afflicted region of the entire West Coast.
with an additional 4-8 ft predicted during this week for WA, OR, and southwest BC!
The climax of this storm cycle has arrived in the Pacific Northwest! The period of maximum sustained snowfall for Washington and Oregon is expected to extend from Sunday through Thursday, with several feet of new powder at further lowering snow levels. Epic!
Two days after the previous update, 4 more subsequent runs of the UW WRF-GFS model at 12-hour intervals continue to predict large snowfall amounts of 4-8 ft over the rest of this week for Washington, Oregon, and southwest BC. This is in addition to 2-8 ft of snow which has already fallen over the past 10 days since this storm cycle began on February 6 at most mountain sites from Bella Coola, BC, south to Mammoth Mountain, CA, plus parts of south-central and southeastern Alaska. New snow of at least a few inches (including up to 12-18" in the North Cascades, Olympics, and southwestern BC) was recorded over the past 24 hours at almost all mountain measurement sites along the Pacific coast from Alyeska near Anchorage, Alaska, all the way south to Mammoth Mountain, a span of about 2100 miles as the crow flies (and over 3100 miles by car ). The snowfall over this vast distance is all due to low-pressure systems spawned from the same upper-level parent low in the Gulf of Alaska which has been associated with this entire storm cycle.
[size=small]Mount Shasta gleaming white on Sunday morning after a few inches of snow overnight, as seen on the SnowCrest webcam .[/size]
The predicted amounts for both precip and snowfall during this week remain similar to those predicted during the last several days, an excellent sign of stability in the model's predictions, with a continuing increase in overall storm totals as further storm systems came into view this weekend and into next week. If these predictions verify and the storm cycle continues as expected for the rest of this week, this will end up solidly in the HUGE storm cycle category with 15-day snowfall totals exceeding 10-12 ft at many sites especially above 4000-5000 ft in the Washington and northern Oregon Cascades plus southwestern BC.
The NWS's GFS model and their Quantitative Precipitation Forecasts still show up to 7-10" of precip over the next week for the mountains of Washington, with 4-5" in southwestern BC and Oregon, and much smaller amounts of only a fraction of an inch extending south into the California Cascades and northern Sierra. Here is total precipitation in inches predicted over the next 7 days through Sunday morning, February 23, with almost all of that shown in the Pacific Northwest falling in the next 5 days though Friday:
The fire hose of the jet stream (see Days 1-5 Jet Stream Analysis & Forecasts ) continues to be aimed directly into the Pacific Northwest, but as predicted it has undergone a major evolution and shift in direction on Saturday February 15, from southwesterly in the latter half of last week to westerly as of Sunday morning (compare with the same image in Update #7 above, this image is almost identical to the prediction 3 days earlier):
By Wednesday the jet stream pattern will further evolve, now approaching from the northwest, and remain that way through Friday, February 21, as it weakens and shifts eastward over the Northwest coast, bringing the heavy precip and snowfall (and this storm cycle) to an end:
Following Saturday's storm systems which brought snow from Alaska to California, there was a minor lull early Sunday with snowfall decreasing over the entire span and skies clearing completely in California. But the next much stronger system moved ashore immediately by midday aimed at Vancouver Island and the Olympics, pushing on to the southwestern BC mainland and Washington Cascades by Sunday afternoon. The heaviest snowfall rates are expected during Sunday evening into early Monday, with 2-4" per hour possible at times. The heaviest snowfall will shift south into the Oregon Cascades during the day Monday, but snow will continue in Washington throughout the day. The next strong system is expected to arrive on Tuesday morning, once again aimed at southwestern BC and Washington, then shifting southward to Oregon by the afternoon and even into northern California overnight. Another weaker wave of snowfall comes ashore on Wednesday morning, then the next strong system is projected to arrive late Wednesday into southwestern BC and Washington again, lasting through the day Thursday with snowfall again shifting into Oregon.
Snowfall during the next 3 days through 4am Wednesday is predicted to be 3-7 ft over the west slopes and volcanic peaks of the Washington and northern Oregon Cascades, the Olympics, and southwestern BC, with 2-4 ft in the southern Oregon Cascades and perhaps up to 1 ft extending into the California Cascades, Trinity Alps, and northern Sierra Nevada on Tuesday-Wednesday:
Higher resolution version of that, showing the Pacific Northwest and also zoomed in on Washington and Oregon:
Maximum snowfall amounts of 4-7 ft (marked by white inside yellow) are shown along the west slopes and volcanic peaks of the Washington and northern Oregon Cascades plus the Olympics. Notably, the Washington graphic above has the largest area with 3-day totals over 4 ft shown in any 3-day graphic in any previous update in this thread (slightly greater than that in Update #
, or either of the two earlier storm threads. So this is expected to be the largest 3-day snowfall in Washington state thus far in the 2013-14 season. The most intense portion of that is Sunday afternoon through Monday afternoon, when even the 24-hour totals are predicted to exceed 4 ft on Mount Rainier above about 5000 ft, with amounts exceeding 3 ft on most of the west slopes and volcanic peaks of the Washington Cascades and Olympics:
It will be very interesting to see if such an extreme snowfall prediction actually verifies, especially since the model has given very similar predictions over the past 2 days, with only a minor reduction in predicted amounts and a slight shift in timing by several hours later. The UW model has become very good over the past several years of development, but extreme predictions often tend not to actually occur, and real 24-hour snowfall amounts may end up in the more reasonable 2-3 ft range.
The maximum snowfall rates predicted by the model are also amazing, with 4-5" per hour during the most intense portion of the storm at some locations. This image zoomed in on western Washington shows snowfall during a 3-hour period early Monday, with 12-16" predicted on Mount Rainier during those 3 hours:
This loop shows how the model predictions for snowfall during the 3-day period through 4am Wednesday have evolved between 10 subsequent runs over the last 5 days, the D(model)/D(t). Very consistent in the overall picture throughout with snowfall amounts increasing and decreasing a bit in BC and Oregon (remaining steadiest for Washington), but no major changes other than a significant reduction in snowfall for northern California:
www.atmos.washington.edu/~ovens/wxloop.c...2+v2014021912///+-st
Additional snowfall during the subsequent 3 days ending 4am next Saturday is predicted to be another 2-3 ft over the west slopes and volcanic peaks of the Washington and northern Oregon Cascades, with 1-2 ft in the Olympics, southwestern BC, and southern Oregon Cascades. Almost all of this snowfall is expected to occur before Friday morning:
It appears almost certain now that this storm cycle will finally dissipate and come to an end by Friday, February 21. But unlike after the first major storm cycle of the 2013-14 season (January 7-14, 2014) , there are no indications of a sustained period of high pressure and fair weather over the entire West Coast after this much-larger storm cycle. The extended GFS model out to 384 hours (16 days) shows additional weaker storm systems during the 6-16 day period into the start of March. This is the predicted 24-hour precip throughout that period, click "Loop All" to see all the graphics (3 hour intervals up to 192 hours, 12 hour intervals beyond that):
GFS, North Pacific, 02/16/2014 18UTC, precip_p24
Storm Cycle History:
The first stage of this storm cycle, aimed primarily at the Sierra Nevada (an atmospheric river) and also at Oregon and southern Washington (frontal snowfall along the boundary between a modified Arctic air mass and warmer air to the south), began early on Thursday, February 6, and ended during the day Monday, February 10. This atmospheric river event produced 4-day precipitation totals of up to 10-17" at many sites near Lake Oroville and Lake Tahoe along the west slopes of the northern Sierra Nevada, with snowfall totals reaching 5-7 ft at sites above 8000 ft from Independence Lake south to Sonora Pass with much lesser amounts of 1-2 ft at 6000 ft. Areas farther south such as Yosemite and Mammoth received much less snowfall, only about 2-3 ft even at 9000 ft, and only 2" total at 9000 ft on June Mountain located just north of Mammoth in the rain shadow of the Sierra Crest. Farther north in the northernmost Sierra Nevada, Trinity Alps, and California Cascades, maximum snowfall amounts were generally 1-3 ft above 6000-7000 ft. The frontal snowfall produced 2-3 ft in the Oregon and southern Washington Cascades, with lesser amounts of about 1 ft as far north as Stevens Pass, barely a few inches in the North Cascades, and almost nothing in southwestern BC which remained cold, clear, and dry. Extensive lowland snowfall down to sea level was also produced during this stage, from the southern Willamette Valley in Oregon all the way north past Seattle and Everett, with maximum amounts of over 6" in parts of northwest Oregon and southwest Washington.
The second stage of this storm cycle had already started as the first was ending on Monday morning February 10, and it extended throughout this week to Sunday, February 16, featuring a series of fronts and systems every 1-2 days in strong southwesterly flow over the north Pacific, aimed primarily at Oregon, Washington, and southwestern British Columbia. The first system of the second stage came ashore Monday morning, and the next much stronger system arrived in the same region on Tuesday afternoon, including another atmospheric river event aimed at Oregon, a few hundred miles farther north than the first atmospheric river aimed at the central Sierra Nevada. This atmospheric river stayed in place through Sunday as it weakened and shifted southward into northern California, bringing some more precipitation to that area over the weekend, before it finally faded away Sunday afternoon. This event produced very high precipitation amounts exceeding 13" on Mount Hood over the last 6 days. Additional snowfall amounts during this stage in the mountains of Oregon, Washington, and southwestern British Columbia were in the 2-5 ft range, with the largest amounts in the northern Oregon Cascades from Mount Hood to Mount Bachelor, which continues to have the largest storm total snowfall of any measurement site in the Northwest with over 7 ft at its 6300 ft base and almost 8 ft at its 7300 ft midstation as of Sunday morning. Given the excessive precip amounts on Mount Hood (about 17" total since February 6), storm total snowfall above 7000 ft likely exceeds 10 ft there already, with about 6.5 ft actually measured at Timberline Lodge (5900 ft) and 5.5 ft at Mount Hood Meadows (5400 ft).
The third and final stage of this storm cycle is underway as of Sunday February 16, following the shift of the jet stream from the southwesterly flow of last week to westerly as of Sunday morning, and eventually to northwesterly by midweek. Strong frontal systems are expected to continue to arrive every 1-2 days through Thursday, before the storm cycle fades out by Friday morning, February 21.
See the table in Reply #21 earlier in this thread for more complete snow and precip totals over the February 6-13 period at more than 170 measurement sites from southwestern BC to the southern Sierra Nevada. An updated table will be posted at some point later this week.
[hr]So how is the snowpack doing now in the Northwest? Here are the NWAC CLISNO reports for February 1 and February 15 (just released this morning):
[tt]
CLIMATOLOGICAL SNOWDEPTH INFORMATION
NORTHWEST WEATHER AND AVALANCHE CENTER SEATTLE WASHINGTON
DAY 1 MONTH 2 YEAR 2014
DATA IN INCHES, -99 DENOTES MISSING DATA
CURRENT CLIMATE PER CENT LAST THRU 2013 THRU 2013
DEPTH AVERAGE OF NORMAL YEAR MAX/YEAR MIN/YEAR
HURRICANE 32 79 41 94 162/1999 10/2005
MT BAKER 82 124 66 153 234/1933 17/1981
STEVENS 61 87 70 88 152/1964 10/1981
SNOQUALMIE 44 78 56 74 154/1964 8/1977
STAMPEDE 40 85 47 -99 228/1946 0/2005
MISSION 22 39 56 36 67/2006 8/1976
CRYSTAL 26 59 44 63 112/1999 6/1977
PARADISE 104 132 79 150 240/1969 27/1977
WHITE PASS 25 53 47 46 110/2008 0/2005
TIMBERLINE 75 119 63 126 238/2002 10/1977
MEADOWS 57 98 58 99 184/1974 9/1977
CLIMATOLOGICAL SNOWDEPTH INFORMATION
NORTHWEST WEATHER AND AVALANCHE CENTER SEATTLE WASHINGTON
DAY 15 MONTH 2 YEAR 2014
DATA IN INCHES, -99 DENOTES MISSING DATA
CURRENT CLIMATE PER CENT LAST THRU 2013 THRU 2013
DEPTH AVERAGE OF NORMAL YEAR MAX/YEAR MIN/YEAR
HURRICANE 44 88 50 100 198/1999 17/2005
MT BAKER 107 138 78 161 244/1999 24/1977
STEVENS 80 94 85 86 166/1956 16/1977
SNOQUALMIE 61 85 72 66 168/1949 4/1977
STAMPEDE 53 90 59 63 202/1949 0/1977
MISSION 38 42 90 35 71/1999 9/1976
CRYSTAL 44 61 72 70 117/1999 0/1977
PARADISE 121 143 85 144 264/1972 24/1977
WHITE PASS 41 55 75 46 100/1999 0/1977
TIMBERLINE 101 128 79 122 230/2002 8/1977
MEADOWS 86 106 81 93 187/1974 4/1977
THIS TABLE PRODUCED ON THE 1ST AND 15TH BETWEEN 15 NOVEMBER AND 1 MAY.
AVERAGES, MAXIMUMS AND MINIMUMS EARLY AND LATE IN THE SEASON MAY BE INACCURATE DUE TO LIMITED DATA.
IF THERE IS TIE FOR THE MAXIMUM OR MINIMUM SNOW DEPTH THEN THE LATEST YEAR IS INDICATED.
RECORDS BEGIN: HURRICANE 1979, MT BAKER 1926, STEVENS 1939, SNOQUALMIE 1929, STAMPEDE 1943,
MISSION RIDGE 1970, CRYSTAL 1967, PARADISE 1926, WHITE PASS 1976, TIMBERLINE 1973, MT HOOD MEADOWS 1974.
NOTE: NRCS DATA USED AT STAMPEDE STARTING 2006-2007 SEASON.
[/tt]
Already a significant improvement in snowpack at all sites as of February 15, and the really heavy snowfall hadn't even begun yet over this region by then, so these numbers are already missing another 4-16" increase in snowdepths since yesterday morning. As of Sunday February 16, Hurricane Ridge is up to 62", Mt Baker 121", Stevens 90", Snoqualmie 65", Stampede 58", Mission Ridge 41", Crystal 50", Paradise 130", White Pass 50", Timberline 110", and Meadows 92" -- over 90% of normal at several sites already! By the time this storm cycle ends on Friday February 21, snowdepths will likely be over 100% of normal at all of these sites, and some sites are likely to be 120-150% of normal for that date. When the next NWAC CLISNO report comes out 8 days after that on March 1, most sites should still be near or above normal even without significant additional snowfall during the last week of February.
Several other sites not included in the NWAC report are already over 100% of normal, including Mount Bachelor which has 105" at its 6300 ft base (roughly 110% of normal) and 130" at its 7300 ft midstation as of Sunday morning. The Chilliwack River BCRFC site at 5300 ft in the BC Cascades (just north of the US border near Mount Baker) reached 138" as of Sunday morning, and is at roughly 120% of normal for snowdepth and snow water equivalent. The Brown Top SNOTEL site (5800 ft near Mount Redoubt in the North Cascades) reached 126" today and might be above 100% of normal too, except it was only installed in 2009 and so normal values are not yet established.
I really do love it when all the gloom-and-doom whiners, those complaining about how bad the early-season snowpack is and how that means the season will be a total bust, turn out to be utterly and completely wrong. At least in Washington, northern Oregon, and southwestern BC, it appears certain that they will be wrong very shortly, and the entire season will be saved and set to go, with a substantial snowpack deep enough to last through spring as usual. Unfortunately there is no such hope on the horizon yet for the far southern end of the Cascades in southernmost Oregon and northernmost California, where the snowpack situation remains bleak at barely 10-25% of normal even after a couple feet of snowfall during the first days of this storm cycle. Hopefully the next major storm cycle will be aimed directly at this most desperately drought-afflicted region of the entire West Coast.
Please Log in or Create an account to join the conversation.
- Andrew Carey
-
- User
-
Less
More
- Posts: 914
- Thank you received: 0
12 years 4 months ago #220429
by Andrew Carey
Replied by Andrew Carey on topic Re: HUGE storm cycle brings 4-12 ft snow Feb6-21,2014!
As usual, a nice, detailed report, Amar. The big question is: Will Mt. Rainier open the road to Paradise this month?
Please Log in or Create an account to join the conversation.
- Amar Andalkar
-
Topic Author
- User
-
Less
More
- Posts: 635
- Thank you received: 0
12 years 4 months ago #220479
by Amar Andalkar
I really shouldn't speculate about the road opening, that is not something that any computer model can yet forecast! But here goes:
This month: the road will open for certain again in February, barring some type of catastrophe.
This week: not likely on any weekday given 1-3 ft of new snow expected each day through Thursday.
But the storm cycle fades out around Friday, so a weekend opening seems reasonable (and Friday is perhaps possible).
Replied by Amar Andalkar on topic Re: HUGE storm cycle brings 4-12 ft snow Feb6-21,2014!
As usual, a nice, detailed report, Amar. The big question is: Will Mt. Rainier open the road to Paradise this month?
I really shouldn't speculate about the road opening, that is not something that any computer model can yet forecast! But here goes:
This month: the road will open for certain again in February, barring some type of catastrophe.
This week: not likely on any weekday given 1-3 ft of new snow expected each day through Thursday.
But the storm cycle fades out around Friday, so a weekend opening seems reasonable (and Friday is perhaps possible).
Please Log in or Create an account to join the conversation.
- Amar Andalkar
-
Topic Author
- User
-
Less
More
- Posts: 635
- Thank you received: 0
12 years 4 months ago - 12 years 4 months ago #220481
by Amar Andalkar
Replied by Amar Andalkar on topic Re: HUGE storm cycle brings 4-12 ft snow Feb6-21,2014!
Update #10: 264 hours after initial post, 2-8 ft of snow has already fallen in southwest BC, Washington, Oregon, and California,
including 1-3 ft in the past 24 hours, with an additional 3-7 ft predicted the rest of this week for WA, OR, and southwest BC!
[size=small]Missed the deepest powder day of the 2013-14 season at Crystal Mountain today, despite leaving Seattle at 5:30am with a good group and driving all the way up there, through heavy snowfall after Enumclaw and ridiculous stop-and-go traffic from Greenwater onward (plus several downed trees and limbs partially blocking the highway) -- only to find the ski area closed for the day due to a power outage and backup generator outage too. So lame, 6 hours of often-stressful driving for zero skiing -- made even worse later when we found out that Chinook Express had opened for FREE (at least for a couple hours) for those who had made it up the Boulevard before its closure, as we had. Would have been nice to ski at least a few runs of powder, but we were told "closed for the entire day" by Crystal employees as we reached the parking lot, and so the decision to turn around was made for us. Oh well, can't win 'em all, especially so it seems at Crystal on big storm days! Anyway, on to the update:[/size]
[size=small]Animation of the Crystal Mountain Campbell Basin Snow Stake Cam from when the snowfall began around 3pm Sunday until the power failed after 5:20am Monday. The 24-hour snowfall total eventually exceeded 2 ft by midday.[/size]
The climax of this storm cycle is ongoing in the Pacific Northwest! The largest 1-day snowfall of the entire storm cycle thus far for Washington has occurred over the last 24 hours since Sunday afternoon, with new snowfall of over 2 ft at many sites throughout the Cascades and Olympics. The period of maximum sustained snowfall for Washington and Oregon is expected to continue through Thursday, with several more feet of new powder at further lowering snow levels. Epic!
Another day later, and 2 more subsequent runs of the UW WRF-GFS model at 12-hour intervals continue to predict large snowfall amounts of 3-7 ft over the rest of this week for Washington, Oregon, and southwest BC. This is in addition to 2-8 ft of snow which has already fallen over the past 11 days since this storm cycle began on February 6 at most mountain measurement sites along the Pacific coast from Alyeska near Anchorage, Alaska, all the way south to Mammoth Mountain, a span of about 2100 miles as the crow flies (and over 3100 miles by car ). The snowfall over this vast distance is all due to low-pressure systems spawned from the same upper-level parent low in the Gulf of Alaska which has been associated with this entire storm cycle.
The predicted amounts for both precip and snowfall during this week remain similar to those predicted during the last several days, an excellent sign of stability in the model's predictions, with a continuing increase in overall storm totals as further storm systems came into view this week. If these predictions verify and the storm cycle continues as expected for the rest of this week, which is now a near-certainty, this will end up solidly in the HUGE storm cycle category with 15-day snowfall totals exceeding 10-12 ft at many sites especially above 4000-5000 ft in the Washington and northern Oregon Cascades plus southwestern BC.
The NWS's GFS model and their Quantitative Precipitation Forecasts still show up to 4-5" more precip over the rest of this week for the mountains of Washington, with 2-3" in southwestern BC and northern Oregon, and much smaller amounts of only a fraction of an inch extending south into the California Cascades and northern Sierra. Here is total precipitation in inches predicted over the next 7 days through Monday afternoon, February 24, with almost all of that shown in the Pacific Northwest falling in the next 5 days though Saturday:
Following Saturday's storm systems which brought snow from Alaska to California, there was a minor lull early Sunday with snowfall decreasing over the entire span and skies clearing completely in California. But the next much stronger system moved ashore immediately by midday aimed at Vancouver Island and the Olympics, pushing on to the southwestern BC mainland and Washington Cascades by Sunday afternoon. The snowfall jackpot was in the Washington Cascades this time, with 24-hour snowfall amounts from Sunday afternoon to Monday afternoon exceeding 2 ft at many measurement sites from the North Cascades south to Mounts Rainier, Adams, and Saint Helens, with lesser amounts of around 1 ft in southwestern BC and on Mount Hood, and only a few inches extending south to Mount Bachelor. The heaviest snowfall shifted south into the Oregon Cascades during the day Monday, but snow also continued in Washington throughout the day.
Maximum 24-hour totals include 30" at Paradise (and the first 28" of that in a 16-hour period), 29" atop Alpental, and 25" at Stevens Pass and Crystal Mountain (both the base and Green Valley). Several SNOTEL sites also recorded increases in snowdepth of 20-26", implying snowfalls of at least 24-30" or more (due to settlement, the increase in total snowdepth is always smaller than the snowfall). The most intense snowfall rates occurred during Sunday evening into early Monday, with 2-4" per hour recorded at times at several different sites.
The large snowfalls also sent many measurement sites in Washington above 100% of normal snowdepth for the first time this season. As of Monday evening February 17, Hurricane Ridge is up to 74" (84% of normal), Mt Baker 133" (96%), Stevens 109" (116%), Snoqualmie 86" (101%), Stampede 81" (90%), Mission Ridge 45" (107%), Crystal 75" (123%), Paradise 155" (108%), White Pass 62" (113%), Timberline 116" (90%), and Meadows 100" (94%). The 155" at Mount Rainier Paradise is apparently now the largest snowdepth of any telemetry site in North America (as far as I know, unless I missed something), a familiar position for Paradise in many a season. Other telemetry sites in the same ballpark include the Chilliwack River BCRFC site at 5300 ft in the BC Cascades (just north of the US border near Mount Baker) at 147", Brown Top SNOTEL (5800 ft near Mount Redoubt in the North Cascades) at 145", Grace Lakes (Stevens Pass, 4800 ft) at 145", the top of White Pass Ski Area (5800 ft) at 139", Lyman Lake SNOTEL (6000 ft near Holden Village) at 138", and Mount Baker Ski Area at 133". Manually measured sites in that range include 147" atop Alpental and 138" at Mount Bachelor mid-mountain (7300 ft).
The next strong system will arrive on Tuesday morning, once again aimed at southwestern BC and Washington, then shifting southward to Oregon by the afternoon and even into northernmost California overnight. Another weaker wave of snowfall comes ashore on Wednesday morning, then the next strong system is projected to arrive late Wednesday into southwestern BC and Washington again, lasting through the day Thursday with snowfall again shifting into Oregon.
Snowfall during the next 3 days through 4pm Thursday is predicted to be 3-6 ft over the west slopes and volcanic peaks of the Washington and northern Oregon Cascades, the Olympics, and southwestern BC, with 2-4 ft in the southern Oregon Cascades and perhaps up to 6" extending into the California Cascades and Trinity Alps on Tuesday-Wednesday, with barely a couple inches in the northern Sierra Nevada:
Higher resolution version of that, showing the Pacific Northwest and also zoomed in on Washington and Oregon:
Maximum snowfall amounts of 4-6 ft (marked by white inside yellow) are shown along the west slopes and volcanic peaks of the Washington and northern Oregon Cascades plus the Olympics. The most intense portion of that period is from Tuesday morning to Wednesday morning, when 24-hour totals of 2-3 ft are predicted for the west slopes and volcanic peaks of the Washington and Oregon Cascades plus the Olympics:
This loop shows how the model predictions for snowfall during the 3-day period through 4pm Thursday have evolved between 10 subsequent runs over the last 5 days, the D(model)/D(t). Very consistent in the overall picture throughout with snowfall amounts increasing and decreasing a bit in BC and Oregon (remaining steadiest for Washington), but no major changes other than a significant reduction in snowfall for northern California:
www.atmos.washington.edu/~ovens/wxloop.c...2+v2014022100///+-st
Additional snowfall during the subsequent 3 days ending 4pm next Sunday is predicted to be another 1-2 ft over the northern Washington Cascades and southwestern BC. Almost all of this snowfall is expected to occur from Friday evening into Saturday afternoon:
This represents an extension of this storm cycle from earlier model runs, by roughly another 24-36 hours and only in the northern Washington Cascades and southwestern BC, where the northwesterly jet stream shifting eastward onto the Pacific coast is now projected to bring an additional moderate system ashore on Friday evening.
However that currently appears to be the end of this storm cycle, with the weekend looking dry especially south of Washington on Saturday and throughout the region on Sunday. Details may certainly change as that period draws closer, as it is currently 5-7 days out, near the limit of accurate numerical weather prediction. Additional snowfall during the 1 day period ending 4pm next Monday is nearly zero over the Pacific Northwest, quite a sharp contrast to any previous graphic shown in this entire thread:
After the mostly dry weekend, the extended GFS model out to 384 hours (16 days) shows additional weaker storm systems during the 9-16 day period from the middle of next week into the start of March. This is the predicted 24-hour precip throughout that period, click "Loop All" to see all the graphics (3 hour intervals up to 192 hours, 12 hour intervals beyond that):
GFS, North Pacific, 02/17/2014 18UTC, precip_p24
Please Log in or Create an account to join the conversation.
- Amar Andalkar
-
Topic Author
- User
-
Less
More
- Posts: 635
- Thank you received: 0
12 years 4 months ago - 12 years 4 months ago #220506
by Amar Andalkar
Replied by Amar Andalkar on topic Re: HUGE storm cycle brings 4-12 ft snow Feb6-21,2014!
So how did the model's predictions of extreme snowfall on Mount Rainier pan out? As posted in Updates #8 and #9 above, the model was showing over 4 ft of snowfall in a 24-hour period from Sunday afternoon through Monday afternoon on Mount Rainier above about 5000 ft, with amounts exceeding 3 ft on most of the west slopes and volcanic peaks of the Washington Cascades and Olympics. As I suspected it would, the actual snowfall amounts fell short of the extreme predictions (at least at any measurement sites), but totals were still impressive with 30" at Paradise in 24 hours (and the first 28" of that in a 16-hour period). The extreme snowfall rates of 4-5" per hour also failed to quite verify, but just barely, with rates of up to 4" per hour during some hours at Paradise:
[tt][size=small]
Northwest Avalanche Center Northwest Avalanche Center
Paradise, Mt Rainier National Park, Washington Camp Muir, Mt Rainier National Park, Washington
Wind speed not reliable and may record periodically Wind gages unheated and may rime
MM/DD Hour Temp RH Wind Wind Wind Hour Total 24 Hr Total Solar MM/DD Hour Temp RH Wind Wind Wind Wind Solar
PST F % Avg Max Dir Prec Prec Snow Snow W/m2 PST F % Min Avg Max Dir W/m2
5400' 5400' 5380' 5380' 5380' 5400' 5400' 5400' 5400' 5400' 10110' 10110' 10110' 10110' 10110' 10110' 10110'
2 16 1400 23 96 0 0 275 0 0 12 130 201 2 16 1400 5 92 30 40 47 286 303
2 16 1500 24 96 0 0 290 0 0 -0 129 126 2 16 1500 3 92 33 41 54 286 132
2 16 1600 24 97 0 0 280 .01 .01 0 127 45 2 16 1600 6 93 36 43 52 286 66
2 16 1700 24 97 0 0 278 .01 .02 2 130 15 2 16 1700 8 94 38 46 59 286 25
2 16 1800 25 97 0 0 282 .06 .08 2 132 1 2 16 1800 8 94 37 47 60 286 3
2 16 1900 25 98 0 0 278 .07 .15 4 133 0 2 16 1900 10 95 41 50 64 286 0
2 16 2000 26 98 0 0 281 .08 .23 5 134 0 2 16 2000 11 95 42 55 68 286 0
2 16 2100 27 98 0 0 273 .11 .34 6 --- 0 2 16 2100 11 95 46 58 67 286 0
2 16 2200 27 98 0 0 266 .16 .5 8 136 0 2 16 2200 12 95 50 61 75 286 0
2 16 2300 28 98 0 0 260 .17 .67 10 138 0 2 16 2300 12 95 50 63 72 286 0
2 17 0 28 99 0 0 262 .17 .84 12 141 0 2 17 0 12 95 53 66 77 286 0
2 17 100 28 99 0 0 267 .13 .97 13 140 0 2 17 100 12 95 53 64 72 286 0
2 17 200 28 99 0 0 273 .1 1.07 -- 142 0 2 17 200 11 95 41 52 67 286 0
2 17 300 27 98 0 0 269 .08 1.15 16 144 0 2 17 300 10 95 35 47 61 286 0
2 17 400 27 98 0 0 268 .17 1.32 20 148 0 2 17 400 11 95 33 43 62 286 0
2 17 500 27 98 0 0 262 .23 1.55 -- 149 0 2 17 500 13 96 21 40 57 286 0
2 17 600 27 98 0 0 255 .2 1.75 23 --- 0 2 17 600 12 95 20 37 51 286 0
2 17 700 27 98 0 0 263 .19 1.94 27 155 0 2 17 700 11 95 21 35 45 286 0
2 17 800 26 98 0 0 261 .12 2.06 28 156 5 2 17 800 12 95 25 39 54 286 16
2 17 900 27 98 0 0 257 .02 2.08 28 155 28 2 17 900 11 95 31 48 70 286 75
2 17 1000 27 98 0 0 264 .08 2.16 28 155 51 2 17 1000 11 94 26 46 68 286 147
2 17 1100 28 98 0 0 262 .03 2.19 29 155 114 2 17 1100 9 94 27 38 53 286 344
2 17 1200 28 98 0 0 259 .04 2.23 28 153 170 2 17 1200 9 94 24 39 63 286 430
2 17 1300 26 98 0 0 262 .05 2.28 30 155 149 2 17 1300 7 93 23 41 61 286 485
2 17 1400 26 98 0 0 259 .02 2.3 29 155 162 2 17 1400 5 92 17 42 62 286 319
2 17 1500 26 97 0 0 260 .03 2.33 30 155 113 2 17 1500 5 92 28 41 57 286 224
2 17 1600 25 97 0 0 262 .01 2.34 29 155 113 2 17 1600 4 92 27 42 56 286 144
2 17 1700 24 97 0 0 261 .02 2.36 0 155 35 2 17 1700 5 92 27 40 59 286 46
2 17 1800 24 97 0 0 262 .02 2.38 0 155 4 2 17 1800 4 92 28 42 54 286 5
2 17 1900 23 97 0 0 267 .01 2.39 0 155 0 2 17 1900 4 92 24 43 59 286 0
2 17 2000 23 97 0 0 261 .03 2.42 1 155 0 2 17 2000 5 92 24 37 50 286 0
2 17 2100 23 97 0 0 270 0 2.42 1 155 0 2 17 2100 4 92 32 41 53 286 0
2 17 2200 24 97 0 0 268 0 2.42 1 154 0 2 17 2200 6 93 24 39 50 286 0
Northwest Avalanche Center Northwest Avalanche Center
Crystal Mountain Ski Area, Washington Green Valley, Crystal Mountain Ski Area
Power out at ski area, precip gage not heating 2-17 Strong winds may affect snowdepth readings
MM/DD Hour Temp Temp RH RH Wind Wind Wind Wind Hour Total 24 Hr Total MM/DD Hour Temp 24 Hr Total
PST F F % % Min Avg Max Dir Prec Prec Snow Snow PST F Snow Snow
6830' 4570' 6830' 4570' 6830' 6830' 6830' 6830' 4570' 4570' 4570' 4570' 6230' 6230' 6230'
2 16 1400 17 26 96 87 13 32 56 252 0 0 0 49 2 16 1400 17 0 97
2 16 1500 18 27 96 92 21 40 68 219 0 0 0 49 2 16 1500 18 1 97
2 16 1600 19 27 97 96 17 35 66 212 .01 .01 1 49 2 16 1600 18 1 98
2 16 1700 19 27 97 98 17 39 67 178 .04 .05 0 50 2 16 1700 18 6 98
2 16 1800 20 27 98 99 14 32 55 250 .05 .1 -- 51 2 16 1800 19 8 99
2 16 1900 20 28 98 99 14 27 48 240 .09 .19 6 53 2 16 1900 19 8 100
2 16 2000 21 28 98 99 13 33 57 210 .1 .29 -- 54 2 16 2000 20 7 100
2 16 2100 22 29 98 100 19 39 60 261 .12 .41 9 56 2 16 2100 20 9 102
2 16 2200 22 29 98 100 21 45 73 247 .13 .54 10 58 2 16 2200 21 10 102
2 16 2300 23 29 99 100 26 49 72 233 .15 .69 12 60 2 16 2300 21 13 104
2 17 0 23 30 99 100 27 53 85 242 .17 .86 15 62 2 17 0 22 15 106
2 17 100 24 30 99 100 20 49 78 273 .18 1.04 17 65 2 17 100 22 15 104
2 17 200 23 30 99 100 9 28 71 228 .13 1.17 19 67 2 17 200 22 16 105
2 17 300 23 28 98 100 19 39 64 220 .05 1.22 -- 68 2 17 300 21 16 107
2 17 400 22 30 98 100 6 29 56 212 .08 1.3 20 68 2 17 400 21 17 107
2 17 500 23 30 99 100 6 17 35 214 .08 1.38 -- 69 2 17 500 21 -- 107
2 17 600 22 29 98 100 4 16 32 248 .03 1.41 -- 71 2 17 600 20 18 109
2 17 700 22 29 98 100 11 22 37 226 .01 1.42 1 73 2 17 700 21 22 112
2 17 800 22 29 98 100 4 17 39 228 0 1.42 2 73 2 17 800 21 22 112
2 17 900 23 30 98 99 5 14 31 249 0 1.42 2 74 2 17 900 22 23 113
2 17 1000 23 30 98 99 4 14 40 244 0 1.42 3 72 2 17 1000 22 23 112
2 17 1100 23 31 98 97 3 14 27 253 0 1.42 3 75 2 17 1100 23 0 112
2 17 1200 23 33 98 95 6 19 35 141 0 1.42 -- 68 2 17 1200 24 0 112
2 17 1300 21 29 98 98 6 22 50 296 0 1.42 5 68 2 17 1300 22 1 113
2 17 1400 21 30 97 95 9 26 63 267 0 1.42 -- 68 2 17 1400 22 2 113
2 17 1500 20 30 97 94 11 27 60 244 0 1.42 5 65 2 17 1500 21 2 113
2 17 1600 20 30 97 94 12 25 47 294 0 1.42 5 68 2 17 1600 20 2 112
2 17 1700 19 27 97 97 8 24 45 260 0 1.42 5 68 2 17 1700 17 3 113
2 17 1800 18 26 97 99 8 25 46 257 0 1.42 6 68 2 17 1800 16 -- 114
2 17 1900 19 26 97 98 6 18 35 267 0 1.42 9 71 2 17 1900 16 6 117
2 17 2000 17 26 96 97 9 25 44 261 0 1.42 10 71 2 17 2000 15 7 117
2 17 2100 17 25 96 97 7 23 47 285 .11 1.53 10 70 Power 2 17 2100 14 7 116
2 17 2200 18 25 96 98 8 23 43 262 .14 1.67 10 70 restored 2 17 2200 15 7 116
[/size][/tt]
Please Log in or Create an account to join the conversation.