- Posts: 635
- Thank you received: 0
Mount Rainier Paradise reaches 200" snow depth
- Amar Andalkar
-
 Topic Author
- User
-

Less
More
15 years 1 week ago - 15 years 1 week ago #199551
by Amar Andalkar
Replied by Amar Andalkar on topic Re: Mount Rainier Paradise reaches 200" snow depth
The unusual and often spectacular 2010-2011 snow season continues delivering the goods into early April. Here are some more updated totals, as recent snowfall in WA and OR has brought most snow measurement sites to new seasonal maxima, and several more sites have reached the 200" mark:
BC:
The Upper Squamish River BCRFC site (4500 ft, west of Whistler and Mt Cayley) reached 226" as of April 6, below its seasonal maximum of 239" on March 16, but still the most of any Canadian telemetry site.
The Whistler ski area has 140" of snowdepth at 5400 ft (135% of normal), below the maximum of 156" on March 16, with 568" of total snowfall to date, its 2nd highest snowfall on record through April 7. This is likely to become only the 2nd season to break 600" at Whistler, trailing the record 673" of 1998-99. By the way, the current #2 snow season was just last year, with 588" in 2009-2010 (snowfall data exists back to 1972-73 at this site).
WA:
Mt Baker Ski Area (4200 ft) hit a new seasonal maximum of 258" on April 6 (about 150% of normal), exceeding its previous seasonal maximum of 253" on March 16, and currently the most of any telemetry site in North America. The ski area also reported a base of 283" at 5000 ft atop Pan Dome, matching its seasonal maximum of 283" on March 17. Seasonal snowfall was finally posted on their website with 682" as of March 17, and about 70-80" more has fallen since then for a total exceeding 750".
Marten Ridge SNOTEL (3520 ft, on the east flank of Mt Baker) reached a seasonal maximum of 192" on April 6, impressive for its comparatively low elevation.
Brown Top SNOTEL (5830 ft, on the long ridge extending east from Mt Redoubt in the North Cascades) reached 197" on April 6, just shy of its seasonal maximum of 202" on March 16-17.
Easy Pass SNOTEL (5270 ft, 8 miles east of Mt Shuksan) has no working snowdepth sensor, but its snow-water equivalent has reached 103" as of April 6, implying a snowdepth of around 240-250".
Buckinghorse SNOTEL (4870 ft, in the Olympics, 12 miles SE of Mt Olympus) has had its snowdepth sensor (mounted much too low) buried by the rising snowpack, and so is stuck reading only 196" since March 10. But it was apparently manually measured at 208" on April 1.
Lyman Lake SNOTEL (5980 ft, 11 miles NE of Glacier Peak) has also apparently had its snowdepth sensor buried by the rising snowpack, and so is stuck reading only 194" since April 1, despite another 3 ft of new snow falling.
Even Stevens and Snoqualmie, which have been struggling to reach normal snowdepths all season, are now solidly over 100% of normal. Stevens Pass reached a seasonal maximum of 139" at 4000 ft on April 6 (about 140% of normal), with 193" atop Skyline Express (5240 ft) and 188" nearby at Grace Lakes (4800 ft). Snoqualmie Pass reached a seasonal maximum of 106" at 3000 ft on April 6 (about 130% of normal), with 122" at the Alpental base (3120 ft) and 207" reported by the ski area atop Alpental (5400 ft).
Paradise reached a new seasonal maximum of 235" on the NWAC telemetry on April 6, far exceeding its previous maximum of 205" on March 29. Snowfall for the season-to-date is reported at 771" as of April 7, with a depth of 245" on the NPS snow stake (a new seasonal maximum and about 140% of normal). Paradise is almost certain to break the 800" mark for snowfall this year, which it has done in only 11 seasons out of 84 years which have total snowfall data (average annual snowfall is 680", the highest average of any measurement site in the world).
Paradise SNOTEL (5130 ft, SW of the old visitor center site) also reached a new seasonal maximum of 207" on April 6.
Cayuse Pass SNOTEL (5240 ft, near the hairpin turn on SR 410 above Cayuse Pass) hit a new seasonal maximum of 221" on April 6, exceeding its previous seasonal maximum of 204" on March 29.
Swift Creek SNOTEL (4440 ft, on the south side of Mt St Helens) has had problems with its snowdepth sensor since January (more and more flaky, then offline), but it was apparently manually measured at 182" on April 1. About 4 ft of new snow has fallen since then, so it probably reached about 220" on April 6.
OR:
Mt Hood, Timberline Lodge (6000 ft) finally and just barely reached the 200" mark on April 6 (about 120% of normal), exceeding its previous seasonal maximum of 185" on March 29, with seasonal snowfall of 624" to date.
No other telemetry sites in Oregon are over 170", although Mt Bachelor Ski Area is reporting a base of 159-179" (at 6300 and 7700 ft), with 577" of snowfall. Crater Lake park headquarters (6400 ft) has a depth of 145" as of April 7 (about 120% of normal), below its seasonal high of 160" on March 29, with snowfall of 578" to date, far surpassing its average annual snowfall of 524".
CA:
In California, the huge March storm cycles (which brought 10-20 ft of snowfall to Shasta, Lassen, and the Sierra Nevada over a 2 week period) ended on March 27-28, followed by sunny weather and almost no additional snowfall through April 6. Snowdepths at many sites (which neared and exceeded 200" during the storms) have now settled by over 40" or even 50" through April 6, when a new system brought another 1-2 ft of snow to the Sierra.
Mt Shasta, Old Ski Bowl (7600 ft) is down to 190" as of April 7, still about 160% of normal, but well off its seasonal maximum of about 230" from March 26-28. The sensor is mounted much too low at this site at only 237" high, and many readings during the maximum period were inconsistent and pegged at this 237" value. The Sand Flat CCSS site (6750 ft, just west of Bunny Flat) is at 145" as of April 7, down from its maximum of about 200" from March 26-28 (this sensor also apparently got buried, with 5 days of no data from March 24-29, and data resuming at 186" on March 29).
Lassen Peak, Lake Helen (8250 ft) is down to 234" as of April 7, still about 130% of normal, but well off its seasonal maximum of 274" on March 26 which was the most of any telemetry site in North America this season. The Lassen Volcanic National Park visitor center (6700 ft) is at 150" as of April 6, down from its maximum of 192" on March 28.
The Meadow Lake CCSS site (7200 ft, north of I-80 and Lake Tahoe) appears to have reached 261" as of March 25 and perhaps 259" as of March 27, but the data was very flaky and intermittent, then all telemetry from the site died completely. A manual snow course measurement showed 228" on March 31.
Independence Lake SNOTEL (8350 ft, 15 miles east of Meadow Lake CCSS site) is down to 167" as of April 6, off its seasonal maximum of 214" on March 25.
Leavitt Lake SNOTEL (9600 ft, west of Bridgeport, well south of Lake Tahoe) is down to 203" as of April 6, off its seasonal maximum of 237" on March 25.
Several other manual monthly snow course sites in the Sierra Nevada also exceeded 200" during the April 1 measurement, see the April measurements here . The overall California snowpack is at 170% of normal, so the 2007-2009 California drought is even more completely over than it was after last year's plentiful late-season snowfall.
The Mammoth Ski Patrol's telemetry site at 9000 ft is down to 160" as of April 6, off its seasonal maximum of 215" on March 25. The nearby Mammoth Pass USBR site (9300 ft) reached 195" on March 21 and again on March 23, apparently that is the height of the snowdepth sensor which got buried at the time. The true seasonal maximum was probably about 225-230" on March 25, which has settled to 176" as of April 6. Snowdepths are building again with renewed snowfall on April 6-7, with seasonal snowfall of 617" as reported by the ski area as of April 7.
I'm not sure what to say about the clustering effect, or even whether it's real. The brain is adept at "seeing" patterns where none really exist (compare seeing faces in the moon and on Mars and on toast, patterns in clouds, etc). I've never read of any weather pattern with such a time-scale that could be the cause. But I've seen the same thing you see in the Paradise snowfall data, too.
Here's a comparison of the annual snowfall stats at Whistler and Mammoth, which both appear to show similar clustering for certain several-year periods (blue line is the current mean, red line the running mean):
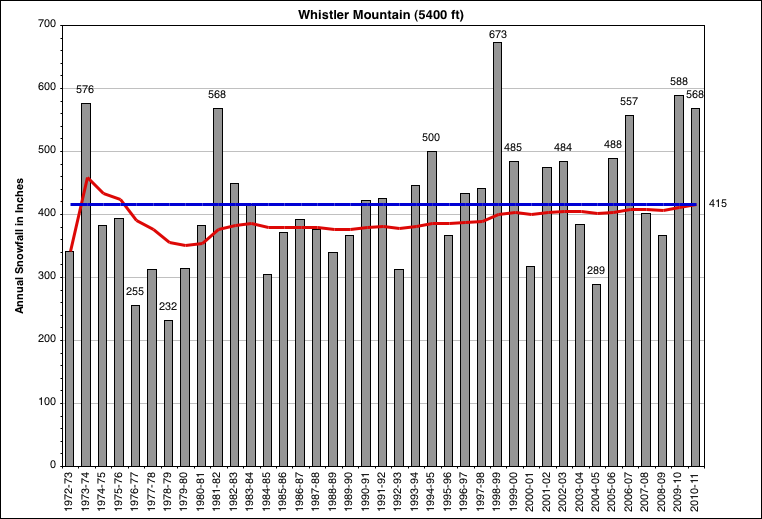
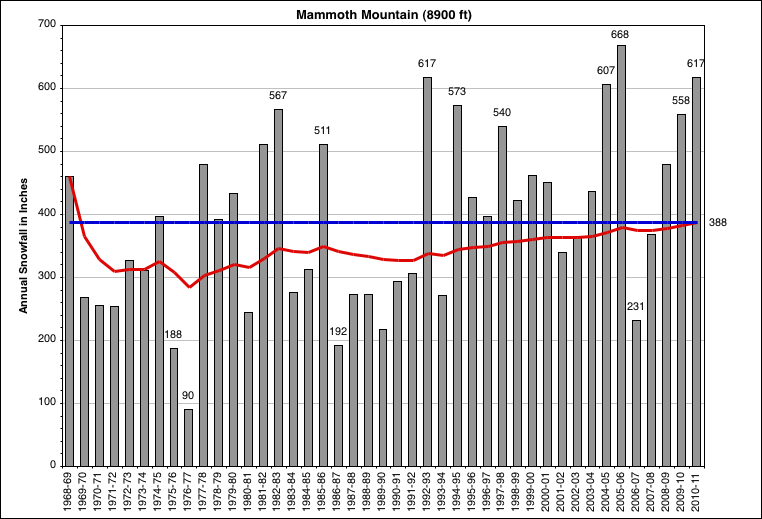
Since I first analyzed the Whistler and Mammoth data several years ago (these sites both had good monthly snowfall data available online unlike almost all other ski areas, and extending back 30-40 years), I've been fascinated by the comparison between the snowfalls at these two massive ski areas. Both have surprisingly similar averages and maxima, but statistically the data sets are very different. Mammoth has a median of 392" with a standard deviation of 138", while Whistler has a median of 394" with a standard deviation of 99". Mammoth has much more variability, with many more huge seasons (4 years over 600") and also far more disastrous years (3 years under 200", with a shocking low of 90") compared to Whistler which is much more consistent (only 1 year over 600" and none below 200").
There are roughly 900 miles and 13 degrees of latitude (37.6 to 50.1 N) between Mammoth and Whistler, and weather patterns which favor one with heavy snowfall tend to leave the other dry. So the fact that this year and last year have both been huge at both ski areas is very odd, especially since 2009-2010 was an El Nino winter and 2010-2011 a La Nina winter. It is highly unusual for these two locations to have near-record snowfalls in the same season as they are doing now, with both likely to end up with their second highest snowfall years.
And even more so this season, it's unusual for essentially every mountain measurement site between those points 900 miles apart to have above normal snowdepth as they do now. Seasonal maxima have reached about 120% of normal in this year's least favored parts of the WA and OR Cascades (Stevens, Snoqualmie, and Hood), but over 150% of normal in southwest BC, the Olympics, and northern WA Cascades, and as much as 180-200% of normal on Shasta and at many sites in the Sierra Nevada. Much of the Rocky Mountains (north of New Mexico at least) has also had a banner snow year, as has the East Coast both in the lowlands and the Appalachian Mountains. That's the most remarkable thing about the 2010-2011 snow season, the vast geographic extent of much-above-normal snowfall in North America.
BC:
The Upper Squamish River BCRFC site (4500 ft, west of Whistler and Mt Cayley) reached 226" as of April 6, below its seasonal maximum of 239" on March 16, but still the most of any Canadian telemetry site.
The Whistler ski area has 140" of snowdepth at 5400 ft (135% of normal), below the maximum of 156" on March 16, with 568" of total snowfall to date, its 2nd highest snowfall on record through April 7. This is likely to become only the 2nd season to break 600" at Whistler, trailing the record 673" of 1998-99. By the way, the current #2 snow season was just last year, with 588" in 2009-2010 (snowfall data exists back to 1972-73 at this site).
WA:
Mt Baker Ski Area (4200 ft) hit a new seasonal maximum of 258" on April 6 (about 150% of normal), exceeding its previous seasonal maximum of 253" on March 16, and currently the most of any telemetry site in North America. The ski area also reported a base of 283" at 5000 ft atop Pan Dome, matching its seasonal maximum of 283" on March 17. Seasonal snowfall was finally posted on their website with 682" as of March 17, and about 70-80" more has fallen since then for a total exceeding 750".
Marten Ridge SNOTEL (3520 ft, on the east flank of Mt Baker) reached a seasonal maximum of 192" on April 6, impressive for its comparatively low elevation.
Brown Top SNOTEL (5830 ft, on the long ridge extending east from Mt Redoubt in the North Cascades) reached 197" on April 6, just shy of its seasonal maximum of 202" on March 16-17.
Easy Pass SNOTEL (5270 ft, 8 miles east of Mt Shuksan) has no working snowdepth sensor, but its snow-water equivalent has reached 103" as of April 6, implying a snowdepth of around 240-250".
Buckinghorse SNOTEL (4870 ft, in the Olympics, 12 miles SE of Mt Olympus) has had its snowdepth sensor (mounted much too low) buried by the rising snowpack, and so is stuck reading only 196" since March 10. But it was apparently manually measured at 208" on April 1.
Lyman Lake SNOTEL (5980 ft, 11 miles NE of Glacier Peak) has also apparently had its snowdepth sensor buried by the rising snowpack, and so is stuck reading only 194" since April 1, despite another 3 ft of new snow falling.
Even Stevens and Snoqualmie, which have been struggling to reach normal snowdepths all season, are now solidly over 100% of normal. Stevens Pass reached a seasonal maximum of 139" at 4000 ft on April 6 (about 140% of normal), with 193" atop Skyline Express (5240 ft) and 188" nearby at Grace Lakes (4800 ft). Snoqualmie Pass reached a seasonal maximum of 106" at 3000 ft on April 6 (about 130% of normal), with 122" at the Alpental base (3120 ft) and 207" reported by the ski area atop Alpental (5400 ft).
Paradise reached a new seasonal maximum of 235" on the NWAC telemetry on April 6, far exceeding its previous maximum of 205" on March 29. Snowfall for the season-to-date is reported at 771" as of April 7, with a depth of 245" on the NPS snow stake (a new seasonal maximum and about 140% of normal). Paradise is almost certain to break the 800" mark for snowfall this year, which it has done in only 11 seasons out of 84 years which have total snowfall data (average annual snowfall is 680", the highest average of any measurement site in the world).
Paradise SNOTEL (5130 ft, SW of the old visitor center site) also reached a new seasonal maximum of 207" on April 6.
Cayuse Pass SNOTEL (5240 ft, near the hairpin turn on SR 410 above Cayuse Pass) hit a new seasonal maximum of 221" on April 6, exceeding its previous seasonal maximum of 204" on March 29.
Swift Creek SNOTEL (4440 ft, on the south side of Mt St Helens) has had problems with its snowdepth sensor since January (more and more flaky, then offline), but it was apparently manually measured at 182" on April 1. About 4 ft of new snow has fallen since then, so it probably reached about 220" on April 6.
OR:
Mt Hood, Timberline Lodge (6000 ft) finally and just barely reached the 200" mark on April 6 (about 120% of normal), exceeding its previous seasonal maximum of 185" on March 29, with seasonal snowfall of 624" to date.
No other telemetry sites in Oregon are over 170", although Mt Bachelor Ski Area is reporting a base of 159-179" (at 6300 and 7700 ft), with 577" of snowfall. Crater Lake park headquarters (6400 ft) has a depth of 145" as of April 7 (about 120% of normal), below its seasonal high of 160" on March 29, with snowfall of 578" to date, far surpassing its average annual snowfall of 524".
CA:
In California, the huge March storm cycles (which brought 10-20 ft of snowfall to Shasta, Lassen, and the Sierra Nevada over a 2 week period) ended on March 27-28, followed by sunny weather and almost no additional snowfall through April 6. Snowdepths at many sites (which neared and exceeded 200" during the storms) have now settled by over 40" or even 50" through April 6, when a new system brought another 1-2 ft of snow to the Sierra.
Mt Shasta, Old Ski Bowl (7600 ft) is down to 190" as of April 7, still about 160% of normal, but well off its seasonal maximum of about 230" from March 26-28. The sensor is mounted much too low at this site at only 237" high, and many readings during the maximum period were inconsistent and pegged at this 237" value. The Sand Flat CCSS site (6750 ft, just west of Bunny Flat) is at 145" as of April 7, down from its maximum of about 200" from March 26-28 (this sensor also apparently got buried, with 5 days of no data from March 24-29, and data resuming at 186" on March 29).
Lassen Peak, Lake Helen (8250 ft) is down to 234" as of April 7, still about 130% of normal, but well off its seasonal maximum of 274" on March 26 which was the most of any telemetry site in North America this season. The Lassen Volcanic National Park visitor center (6700 ft) is at 150" as of April 6, down from its maximum of 192" on March 28.
The Meadow Lake CCSS site (7200 ft, north of I-80 and Lake Tahoe) appears to have reached 261" as of March 25 and perhaps 259" as of March 27, but the data was very flaky and intermittent, then all telemetry from the site died completely. A manual snow course measurement showed 228" on March 31.
Independence Lake SNOTEL (8350 ft, 15 miles east of Meadow Lake CCSS site) is down to 167" as of April 6, off its seasonal maximum of 214" on March 25.
Leavitt Lake SNOTEL (9600 ft, west of Bridgeport, well south of Lake Tahoe) is down to 203" as of April 6, off its seasonal maximum of 237" on March 25.
Several other manual monthly snow course sites in the Sierra Nevada also exceeded 200" during the April 1 measurement, see the April measurements here . The overall California snowpack is at 170% of normal, so the 2007-2009 California drought is even more completely over than it was after last year's plentiful late-season snowfall.
The Mammoth Ski Patrol's telemetry site at 9000 ft is down to 160" as of April 6, off its seasonal maximum of 215" on March 25. The nearby Mammoth Pass USBR site (9300 ft) reached 195" on March 21 and again on March 23, apparently that is the height of the snowdepth sensor which got buried at the time. The true seasonal maximum was probably about 225-230" on March 25, which has settled to 176" as of April 6. Snowdepths are building again with renewed snowfall on April 6-7, with seasonal snowfall of 617" as reported by the ski area as of April 7.
Any thoughts about the climatology regarding the clustering of the heavy snow years recently at Mammoth?
I've noticed that heavy snow years are often grouped in six to seven year periods in the Paradise records. Wonder why?
I'm not sure what to say about the clustering effect, or even whether it's real. The brain is adept at "seeing" patterns where none really exist (compare seeing faces in the moon and on Mars and on toast, patterns in clouds, etc). I've never read of any weather pattern with such a time-scale that could be the cause. But I've seen the same thing you see in the Paradise snowfall data, too.
Here's a comparison of the annual snowfall stats at Whistler and Mammoth, which both appear to show similar clustering for certain several-year periods (blue line is the current mean, red line the running mean):
Since I first analyzed the Whistler and Mammoth data several years ago (these sites both had good monthly snowfall data available online unlike almost all other ski areas, and extending back 30-40 years), I've been fascinated by the comparison between the snowfalls at these two massive ski areas. Both have surprisingly similar averages and maxima, but statistically the data sets are very different. Mammoth has a median of 392" with a standard deviation of 138", while Whistler has a median of 394" with a standard deviation of 99". Mammoth has much more variability, with many more huge seasons (4 years over 600") and also far more disastrous years (3 years under 200", with a shocking low of 90") compared to Whistler which is much more consistent (only 1 year over 600" and none below 200").
There are roughly 900 miles and 13 degrees of latitude (37.6 to 50.1 N) between Mammoth and Whistler, and weather patterns which favor one with heavy snowfall tend to leave the other dry. So the fact that this year and last year have both been huge at both ski areas is very odd, especially since 2009-2010 was an El Nino winter and 2010-2011 a La Nina winter. It is highly unusual for these two locations to have near-record snowfalls in the same season as they are doing now, with both likely to end up with their second highest snowfall years.
And even more so this season, it's unusual for essentially every mountain measurement site between those points 900 miles apart to have above normal snowdepth as they do now. Seasonal maxima have reached about 120% of normal in this year's least favored parts of the WA and OR Cascades (Stevens, Snoqualmie, and Hood), but over 150% of normal in southwest BC, the Olympics, and northern WA Cascades, and as much as 180-200% of normal on Shasta and at many sites in the Sierra Nevada. Much of the Rocky Mountains (north of New Mexico at least) has also had a banner snow year, as has the East Coast both in the lowlands and the Appalachian Mountains. That's the most remarkable thing about the 2010-2011 snow season, the vast geographic extent of much-above-normal snowfall in North America.
Please Log in or Create an account to join the conversation.
- AndyMartin
-
- User
-
Less
More
- Posts: 51
- Thank you received: 0
15 years 1 week ago #199555
by AndyMartin
Replied by AndyMartin on topic Re: Mount Rainier Paradise reaches 200" snow depth
Amar (and Gary),
This is a facinating thread - thanks for finding all the data and collecting it all in one place.
This is a facinating thread - thanks for finding all the data and collecting it all in one place.
Please Log in or Create an account to join the conversation.
- AndyMartin
-
- User
-
Less
More
- Posts: 51
- Thank you received: 0
15 years 1 week ago #199556
by AndyMartin
Replied by AndyMartin on topic Re: Mount Rainier Paradise reaches 200" snow depth
Utah is also doing well, with Alta reporting 609" year to date and a base of 184" as of April 8. A lot more snow is in the forecast as well.
Please Log in or Create an account to join the conversation.
- garyabrill
-
- User
-
Less
More
- Posts: 464
- Thank you received: 0
15 years 1 week ago #199586
by garyabrill
Replied by garyabrill on topic Re: Mount Rainier Paradise reaches 200" snow depth
Thanks, again, Amar. Really cool stuff. I don't think I'd have noticed the clustering if I hadn't also seen it in Rainier's data. I remember walking into the old visitor's center and seeing a board with the annual snowfall totals. To me Rainier's data also had the same pattern both for good and bad periods as we see on the Mammoth data.
I've sometimes thought that looking at spring/summer weather seems to show a pattern over several years that is even more perceptible than the one that may be showing up in winter. For instance, up until about three years ago the springs seemed to arrive early and the summers seemed to be warmer and especially drier than normal with long periods without rain. Then over the past three summers, each summer has been worse than the one before with last summer taking the cake.
I'm guessing here, but I kind of think that there are longer patterns in the range of 6 to 7 years that have to have more than just El Nino and La Nina to explain them. As a matter of fact (to use the term loosely) it may be that last spring and summer's bad weather presaged this winter's La Nina even before sea surface temperatures showed the approach of La Nina. Something, but what?
Please Log in or Create an account to join the conversation.
- garyabrill
-
- User
-
Less
More
- Posts: 464
- Thank you received: 0
15 years 1 week ago #199616
by garyabrill
Replied by garyabrill on topic Re: Mount Rainier Paradise reaches 200" snow depth
Thought I'd add this to the thread concerning climatological NW snow depths as compared to the present (from NWAC):
www.nwac.us/data/CLISNO
www.nwac.us/data/CLISNO
Please Log in or Create an account to join the conversation.
- Amar Andalkar
-
Topic Author
- User
-
Less
More
- Posts: 635
- Thank you received: 0
15 years 1 week ago #199673
by Amar Andalkar
Replied by Amar Andalkar on topic Re: Mount Rainier Paradise reaches 200" snow depth
Here's the actual CLISNO data for April 1, posted for posterity:
[tt]
CLIMATOLOGICAL SNOWDEPTH INFORMATION
NORTHWEST WEATHER AND AVALANCHE CENTER SEATTLE WASHINGTON
DAY 1 MONTH 4 YEAR 2011
DATA IN INCHES, -99 DENOTES MISSING DATA
CURRENT CLIMATE PER CENT LAST THRU 2010 THRU 2010
DEPTH AVERAGE OF NORMAL YEAR MAX/YEAR MIN/YEAR
HURRICANE 153 105 146 110 252/1999 42/2005
MT BAKER 230 173 133 173 311/1999 72/1934
STEVENS 108 101 107 84 192/1956 24/1941
SNOQUALMIE 82 85 96 51 170/1956 2/1992
STAMPEDE 82 100 82 58 183/1956 17/1992
MISSION 58 47 123 47 86/1983 20/1973
CRYSTAL 97 71 137 81 144/1999 16/1981
PARADISE 208 174 120 153 327/1956 66/1941
WHITE PASS 62 56 111 54 110/1997 0/1992
TIMBERLINE 165 164 101 155 300/1999 57/1981
MEADOWS 129 129 100 125 199/2008 49/2005
[/tt]
April 1 is normally the most important day of the year for snowpack and snowdepth measurements, since on average the snowdepth maximum occurs near April 1 at most mountain sites of sufficient elevation, throughout the western US and southwestern Canada. Most water resources predictions for the summer are based on April 1 snowpack data (snow-water content). Unfortunately, by random chance this year, April 1 was not a very good day for big snowdepths in WA and OR, coming after the huge rainstorm which dumped 4-8" of precip at snow levels reaching 7000+ ft on March 29-31.
Even though the rainstorm did not reduce snowdepths much, it did nothing to help them, and then immediately afterward was followed by heavy snowfall at much lower snow levels. Thus several sites look near or below normal in that table, when they no longer were so low even a few days after April 1. Snowdepths increased by 2-3 ft at those sites by April 6, putting all sites over 100% of normal. The continued snowfall since then will ensure that the April 15 CLISNO looks much more favorable when it comes out.
Please Log in or Create an account to join the conversation.