- Posts: 635
- Thank you received: 0
How unusual is the current low PNW snowpack?
- Amar Andalkar
-
 Topic Author
- User
-

Less
More
12 years 6 months ago - 12 years 6 months ago #211304
by Amar Andalkar
How unusual is the current low PNW snowpack? was created by Amar Andalkar
How unusual is the current low snowpack in the Pacific Northwest? Does it mean that this whole season is likely to be a bust?
There's seems to be some rising belief among many people that the currently well-below-normal snowpack in the Pacific Northwest is very unusual, something not seen in many years. Perhaps even more people seem to believe that the current low snowpack may portend below-normal snowfall and snowpack throughout the winter, even that the whole season may be a bust. The 11pm TV newscasts were rife with just such speculation, including major segments filmed at Snoqualmie Pass showing the thin brushy snowpack.
I suspected that these beliefs have little basis in fact, nor would they have much support in the actual snowpack data. But as a scientist, I always prefer to scrutinize the data before jumping to conclusions. So I decided to look through the NWAC's twice-monthly climatological snowdepth information ( www.nwac.us/data/CLISNO ) for the last 17 years, to find out how many of those seasons had significantly below-normal snowpack as of December 1 and 15, and then to see whether those seasons remained below normal overall by season's end. (Archived CLISNO data are not available on the NWAC website, but files back to 1997 have been archived on my website at www.skimountaineer.com/CascadeSki/CascadeSnowNWAC.html .)
The following list shows the years which have had a December 15 snowpack below about 70% of normal throughout these sites in Washington and northern Oregon. Although the current snowpack is well below normal, it is nevertheless well above the minimum values recorded for December 15 at most of these sites (many of the record lows are from 1976, as the 1976-77 season was a severe drought year throughout the West Coast, and the worst overall snow year over that entire region in the last 70+ years). However, new record lows for December 15 were set yesterday at Crystal Mountain base (barely) and Hurricane Ridge (by a significant margin, about half the previous minimum of 19" in 1980 -- although the actual record low appears to be 5" in 2004 as seen in that data farther below, revised values from the historical CLISNO data file I acquired several years ago courtesy of NWAC indicate that the correct depth at Hurricane Ridge on 15Dec2004 was 21").
[tt]2013-2014[size=small]
CLIMATOLOGICAL SNOWDEPTH INFORMATION CLIMATOLOGICAL SNOWDEPTH INFORMATION
NORTHWEST WEATHER AND AVALANCHE CENTER SEATTLE WASHINGTON NORTHWEST WEATHER AND AVALANCHE CENTER SEATTLE WASHINGTON
DAY 1 MONTH 12 YEAR 2013 DAY 15 MONTH 12 YEAR 2013
DATA IN INCHES, -99 DENOTES MISSING DATA DATA IN INCHES, -99 DENOTES MISSING DATA
CURRENT CLIMATE PER CENT LAST THRU 2012 THRU 2012 CURRENT CLIMATE PER CENT LAST THRU 2012 THRU 2012
DEPTH AVERAGE OF NORMAL YEAR MAX/YEAR MIN/YEAR DEPTH AVERAGE OF NORMAL YEAR MAX/YEAR MIN/YEAR
HURRICANE 5 32 16 38 70/2006 0/2002 HURRICANE 10 50 20 56 83/2006 19/1980
MT BAKER 32 49 65 51 140/1948 1/1939 MT BAKER 43 68 63 94 168/1948 16/1976
STEVENS 18 31 58 25 67/1942 0/2002 STEVENS 26 44 59 65 80/1973 5/1976
SNOQUALMIE 5 25 20 12 84/1955 0/2008 SNOQUALMIE 9 36 25 41 116/1948 0/1976
STAMPEDE 5 30 17 8 93/1945 0/2008 STAMPEDE 10 42 24 35 119/1948 9/1976
MISSION 8 17 47 16 36/1983 0/2008 MISSION 14 24 58 26 49/2006 4/1975
CRYSTAL 4 25 16 12 59/2001 0/2008 CRYSTAL 9 35 26 35 72/1996 10/1979
PARADISE 31 48 65 37 125/1994 1/2008 PARADISE 42 68 62 85 170/1948 4/1976
WHITE PASS 0 19 0 3 53/1984 0/2008 WHITE PASS 4 29 14 23 73/1996 2/1989
TIMBERLINE 21 46 46 35 137/1984 0/2002 TIMBERLINE 27 64 42 63 145/1984 0/1976
MEADOWS 18 40 45 26 113/1984 5/2008 MEADOWS 24 55 44 49 118/1984 8/1989
AVERAGES, MAXIMUMS AND MINIMUMS EARLY AND LATE IN THE SEASON MAY BE AVERAGES, MAXIMUMS AND MINIMUMS EARLY AND LATE IN THE SEASON MAY BE
INACCURATE DUE TO LIMITED DATA. INACCURATE DUE TO LIMITED DATA.
IF THERE IS TIE FOR THE MAXIMUM OR MINIMUM SNOW DEPTH THEN THE IF THERE IS TIE FOR THE MAXIMUM OR MINIMUM SNOW DEPTH THEN THE
LATEST YEAR IS INDICATED. LATEST YEAR IS INDICATED.
RECORDS BEGIN: HURRICANE 1979, MT BAKER 1926, STEVENS 1939, RECORDS BEGIN: HURRICANE 1979, MT BAKER 1926, STEVENS 1939,
SNOQUALMIE 1929, STAMPEDE 1943, MISSION RIDGE 1970, SNOQUALMIE 1929, STAMPEDE 1943, MISSION RIDGE 1970,
CRYSTAL 1967, PARADISE 1926, WHITE PASS 1976, CRYSTAL 1967, PARADISE 1926, WHITE PASS 1976,
TIMBERLINE 1973, MT HOOD MEADOWS 1974. TIMBERLINE 1973, MT HOOD MEADOWS 1974.
NOTE: NRCS DATA USED AT STAMPEDE STARTING 2006-2007 SEASON. NOTE: NRCS DATA USED AT STAMPEDE STARTING 2006-2007 SEASON.
[/size]
[hr]2008-2009[size=small]
CLIMATOLOGICAL SNOWDEPTH INFORMATION CLIMATOLOGICAL SNOWDEPTH INFORMATION
NORTHWEST WEATHER AND AVALANCHE CENTER SEATTLE WASHINGTON NORTHWEST WEATHER AND AVALANCHE CENTER SEATTLE WASHINGTON
DAY 1 MONTH 12 YEAR 2008 DAY 15 MONTH 12 YEAR 2008
DATA IN INCHES, -99 DENOTES MISSING DATA DATA IN INCHES, -99 DENOTES MISSING DATA
CURRENT CLIMATE PER CENT LAST THRU 2007 THRU 2007 CURRENT CLIMATE PER CENT LAST THRU 2007 THRU 2007
DEPTH AVERAGE OF NORMAL YEAR MAX/YEAR MIN/YEAR DEPTH AVERAGE OF NORMAL YEAR MAX/YEAR MIN/YEAR
HURRICANE 2 32 6 13 70/2006 0/2002 HURRICANE 20 52 38 28 83/2006 19/1980
MT BAKER 7 50 14 34 140/1948 1/1939 MT BAKER 36 68 53 52 168/1948 16/1976
STEVENS 4 32 12 21 67/1942 0/2002 STEVENS 23 44 52 39 80/1973 5/1976
SNOQUALMIE 0 25 0 17 84/1955 0/2002 SNOQUALMIE 17 36 47 33 116/1948 0/1976
STAMPEDE 0 30 0 9 93/1945 0/2002 STAMPEDE 15 44 34 22 119/1948 9/1976
MISSION 0 18 0 11 36/1983 0/2002 MISSION 6 25 24 14 49/2006 4/1975
CRYSTAL 0 25 0 20 59/2001 0/2002 CRYSTAL 22 35 63 23 72/1996 10/1979
PARADISE 1 48 2 33 125/1994 1/1976 PARADISE 45 68 66 48 170/1948 4/1976
WHITE PASS 0 20 0 19 53/1984 0/2002 WHITE PASS 20 29 69 8 73/1996 2/1989
TIMBERLINE 5 46 11 38 137/1984 0/2002 TIMBERLINE 35 65 54 38 145/1984 0/1976
MEADOWS 5 40 12 41 113/1984 7/2004 MEADOWS 29 56 52 38 118/1984 8/1989
[/size]
[hr]2007-2008[size=small]
CLIMATOLOGICAL SNOWDEPTH INFORMATION CLIMATOLOGICAL SNOWDEPTH INFORMATION
NORTHWEST WEATHER AND AVALANCHE CENTER SEATTLE WASHINGTON NORTHWEST WEATHER AND AVALANCHE CENTER SEATTLE WASHINGTON
DAY 1 MONTH 12 YEAR 2007 DAY 15 MONTH 12 YEAR 2007
DATA IN INCHES, -99 DENOTES MISSING DATA DATA IN INCHES, -99 DENOTES MISSING DATA
CURRENT CLIMATE PER CENT LAST THRU 2006 THRU 2006 CURRENT CLIMATE PER CENT LAST THRU 2006 THRU 2006
DEPTH AVERAGE OF NORMAL YEAR MAX/YEAR MIN/YEAR DEPTH AVERAGE OF NORMAL YEAR MAX/YEAR MIN/YEAR
HURRICANE 13 33 39 70 70/2006 0/2002 HURRICANE 28 53 53 83 83/2006 19/1980
MT BAKER 34 50 68 117 140/1948 1/1939 MT BAKER 52 68 76 113 168/1948 16/1976
STEVENS 21 32 66 55 67/1942 0/2002 STEVENS 39 44 89 77 80/1973 5/1976
SNOQUALMIE 17 25 68 51 84/1955 0/2002 SNOQUALMIE 33 36 92 60 116/1948 0/1976
STAMPEDE 9 31 29 -99 93/1945 0/2002 STAMPEDE 22 44 50 -99 119/1948 9/1976
MISSION 11 18 61 19 36/1983 0/2002 MISSION 14 25 56 49 49/2006 4/1975
CRYSTAL 20 25 80 55 59/2001 0/2002 CRYSTAL 23 35 66 56 72/1996 10/1979
PARADISE 33 48 69 -99 125/1994 1/1976 PARADISE 48 68 71 90 170/1948 4/1976
WHITE PASS 19 20 95 40 53/1984 0/2002 WHITE PASS 8 30 27 -99 73/1996 2/1989
TIMBERLINE 38 46 83 83 137/1984 0/2002 TIMBERLINE 38 65 58 73 145/1984 0/1976
MEADOWS 41 40 102 69 113/1984 7/2004 MEADOWS 38 56 68 66 118/1984 8/1989
[/size]
[hr]2004-2005[size=small]
CLIMATOLOGICAL SNOWDEPTH INFORMATION CLIMATOLOGICAL SNOWDEPTH INFORMATION
NORTHWEST WEATHER AND AVALANCHE CENTER NORTHWEST WEATHER AND AVALANCHE CENTER
ISSUED THROUGH NATIONAL WEATHER SERVICE SEATTLE ISSUED THROUGH NATIONAL WEATHER SERVICE SEATTLE
FOR : DAY 1 MONTH 12 YEAR 2004 FOR : DAY 15 MONTH 12 YEAR 2004
DATA IN INCHES, -99 DENOTES MISSING DATA DATA IN INCHES, -99 DENOTES MISSING DATA
CURRENT CLIMATE PER CENT LAST THRU 2003 THRU 2003 CURRENT CLIMATE PER CENT LAST THRU 2003 THRU 2003
DEPTH AVERAGE OF NORMAL YEAR MAX/YEAR MIN/YEAR DEPTH AVERAGE OF NORMAL YEAR MAX/YEAR MIN/YEAR
HURRICANE 5 32 16 33 64/1994 0/2002 HURRICANE 5 55 9 62 80/1996 19/1980
MT BAKER 25 49 51 72 140/1948 1/1939 MT BAKER 40 68 59 106 168/1948 16/1976
STEVENS 13 31 42 41 67/1942 0/2002 STEVENS 22 44 50 72 80/1973 5/1976
SNOQUALMIE 10 25 40 30 84/1955 0/2002 SNOQUALMIE 11 36 31 68 116/1948 0/1976
STAMPEDE -99 31 -99 33 93/1945 0/2002 STAMPEDE 12 45 27 66 119/1948 9/1976
MISSION 1 19 5 16 36/1983 0/2002 MISSION 6 25 24 29 47/1983 4/1975
CRYSTAL 6 25 24 29 59/2001 0/2002 CRYSTAL 13 35 37 51 72/1996 10/1979
PARADISE 25 48 52 59 125/1994 1/1976 PARADISE 36 69 52 103 170/1948 4/1976
WHITE PASS 5 19 26 17 53/1984 0/2002 WHITE PASS 4 31 13 47 73/1996 2/1989
TIMBERLINE 28 46 61 50 137/1984 0/2002 TIMBERLINE 44 66 67 89 145/1984 0/1976
MEADOWS 7 41 17 36 113/1984 8/2002 MEADOWS 19 57 33 61 118/1984 8/1989
[/size]
[hr]2002-2003[size=small]
CLIMATOLOGICAL SNOWDEPTH INFORMATION CLIMATOLOGICAL SNOWDEPTH INFORMATION
NORTHWEST WEATHER AND AVALANCHE CENTER NORTHWEST WEATHER AND AVALANCHE CENTER
ISSUED THROUGH NATIONAL WEATHER SERVICE SEATTLE ISSUED THROUGH NATIONAL WEATHER SERVICE SEATTLE
FOR : DAY 1 MONTH 12 YEAR 2002 FOR : DAY 15 MONTH 12 YEAR 2002
DATA IN INCHES, -99 DENOTES MISSING DATA DATA IN INCHES, -99 DENOTES MISSING DATA
CURRENT CLIMATE PER CENT LAST THRU 2001 THRU 2001 CURRENT CLIMATE PER CENT LAST THRU 2001 THRU 2001
DEPTH AVERAGE OF NORMAL YEAR MAX/YEAR MIN/YEAR DEPTH AVERAGE OF NORMAL YEAR MAX/YEAR MIN/YEAR
MT BAKER 16 49 33 58 140/1948 1/1939 MT BAKER 31 68 46 104 168/1948 16/1976
STEVENS 0 32 0 37 67/1942 0/1941 STEVENS 19 44 43 66 80/1973 5/1976
SNOQUALMIE 0 25 0 44 84/1955 1/1969 SNOQUALMIE 12 36 33 61 116/1948 0/1976
STAMPEDE 0 31 0 41 93/1945 0/1976 STAMPEDE -99 44 -99 -99 119/1948 9/1976
PARADISE 8 48 17 68 125/1994 1/1976 PARADISE 36 69 52 114 170/1948 4/1976
WHITE PASS 0 20 0 30 53/1984 1/1999 WHITE PASS 12 31 39 42 73/1996 2/1989
MT HOOD 8 43 19 60 113/1984 10/1995 MT HOOD 10 59 17 110 118/1984 8/1989
[/size]
[hr]1997-1998[size=small]
CLIMATOLOGICAL SNOWDEPTH INFORMATION CLIMATOLOGICAL SNOWDEPTH INFORMATION
NORTHWEST WEATHER AND AVALANCHE CENTER NORTHWEST WEATHER AND AVALANCHE CENTER
ISSUED THROUGH NATIONAL WEATHER SERVICE SEATTLE ISSUED THROUGH NATIONAL WEATHER SERVICE SEATTLE
DAY 1 MONTH 12 YEAR 1997 DAY 15 MONTH 12 YEAR 1997
DATA IN INCHES, -99 DENOTES MISSING DATA DATA IN INCHES, -99 DENOTES MISSING DATA
CURRENT CLIMATE PER CENT THIS DATE CURRENT CLIMATE PER CENT THIS DATE
DEPTH AVERAGE OF NORMAL LAST YEAR DEPTH AVERAGE OF NORMAL LAST YEAR
MT BAKER 21 49 43 50 MT BAKER 33 67 49 130
STEVENS 18 32 56 41 STEVENS 25 44 57 70
SNOQUALMIE 8 25 32 35 SNOQUALMIE 16 35 46 72
STAMPEDE 10 32 31 49 STAMPEDE 20 45 44 77
PARADISE 48 48 100 77 PARADISE 51 68 75 130
WHITE PASS 12 22 55 35 WHITE PASS 16 32 50 73
MT HOOD 19 45 42 46 MT HOOD 28 58 48 116
[/size][/tt]
So 6 years out of the past 17 (including this year) have had a December 15 snowpack below roughly 70% of normal throughout these sites, with 3 of those years below roughly 60% of normal (2013, 2004, 2002). This is a fairly small set of data, but it certainly appears that well-below-normal snowpacks as of December 15 occur approximately every 3-5 years, with snowpacks as low as the current one occurring 1-2 times per decade. Therefore the current low snowpack is not really that unusual.
[size=small](Note: these posts were split due to the 20,000 character limit per post)[/size]
Please Log in or Create an account to join the conversation.
- Amar Andalkar
-
Topic Author
- User
-
Less
More
- Posts: 635
- Thank you received: 0
12 years 6 months ago - 12 years 6 months ago #211305
by Amar Andalkar
Replied by Amar Andalkar on topic Re: How unusual is the current low PNW snowpack?
So how strongly does a well-below-normal December 15 snowpack correlate with an overall low snowfall and low snowpack throughout the winter and spring?
The standard one-parameter measure of an entire season's snowpack is the April 1 snowdepth, which correlates well with total season snowfall at these type of high-snowfall mountain sites. Shown below are the April 1 and April 15 CLISNO data recorded 4 months later on in each of the seasons shown above (except the current season, obviously). Snowfall totals for the entire season are also shown, along with calculated percents of normal, for the only 3 of these sites where such data is readily available.
[tt]2008-2009 -- weak La Niña[size=small]
CLIMATOLOGICAL SNOWDEPTH INFORMATION CLIMATOLOGICAL SNOWDEPTH INFORMATION
NORTHWEST WEATHER AND AVALANCHE CENTER SEATTLE WASHINGTON NORTHWEST WEATHER AND AVALANCHE CENTER SEATTLE WASHINGTON
DAY 1 MONTH 4 YEAR 2009 DAY 15 MONTH 4 YEAR 2009
DATA IN INCHES, -99 DENOTES MISSING DATA DATA IN INCHES, -99 DENOTES MISSING DATA
CURRENT CLIMATE PER CENT LAST THRU 2008 THRU 2008 CURRENT CLIMATE PER CENT LAST THRU 2008 THRU 2008
DEPTH AVERAGE OF NORMAL YEAR MAX/YEAR MIN/YEAR DEPTH AVERAGE OF NORMAL YEAR MAX/YEAR MIN/YEAR
HURRICANE 93 106 88 137 252/1999 42/2005 HURRICANE 92 110 84 122 252/1999 51/2005
MT BAKER 143 174 82 197 311/1999 72/1934 MT BAKER 145 167 87 185 290/1999 56/1934
STEVENS 115 101 114 131 192/1956 24/1941 STEVENS 102 93 110 116 170/1956 17/1941
SNOQUALMIE 102 86 119 131 170/1956 2/1992 SNOQUALMIE 89 72 124 121 153/1974 0/1992
STAMPEDE 127 100 127 144 183/1956 17/1992 STAMPEDE 111 98 113 131 216/1964 9/1992
MISSION 49 46 107 55 86/1983 20/1973 MISSION 44 45 98 45 79/1983 21/1990
CRYSTAL 93 70 133 105 144/1999 16/1981 CRYSTAL 87 72 121 98 130/1999 30/1981
PARADISE 185 175 106 240 327/1956 66/1941 PARADISE 176 172 102 213 302/1972 68/1934
WHITE PASS 98 54 181 95 110/1997 0/1992 WHITE PASS 65 44 148 80 95/1997 0/1992
TIMBERLINE 199 163 122 225 300/1999 57/1981 TIMBERLINE 211 162 130 226 300/1999 71/1977
MEADOWS 166 128 130 199 199/2008 49/2005 MEADOWS 160 125 128 194 194/2008 54/2005
Snowfall: Season Climate % of
Total Average Normal
MT BAKER 548 620 88%
SNOQUALMIE 433 430 101%
PARADISE 734 650 113%
[/size]
[hr]2007-2008 -- strong La Niña[size=small]
CLIMATOLOGICAL SNOWDEPTH INFORMATION CLIMATOLOGICAL SNOWDEPTH INFORMATION
NORTHWEST WEATHER AND AVALANCHE CENTER SEATTLE WASHINGTON NORTHWEST WEATHER AND AVALANCHE CENTER SEATTLE WASHINGTON
DAY 1 MONTH 4 YEAR 2008 DAY 15 MONTH 4 YEAR 2008
DATA IN INCHES, -99 DENOTES MISSING DATA DATA IN INCHES, -99 DENOTES MISSING DATA
CURRENT CLIMATE PER CENT LAST THRU 2007 THRU 2007 CURRENT CLIMATE PER CENT LAST THRU 2007 THRU 2007
DEPTH AVERAGE OF NORMAL YEAR MAX/YEAR MIN/YEAR DEPTH AVERAGE OF NORMAL YEAR MAX/YEAR MIN/YEAR
HURRICANE 137 104 132 108 252/1999 42/2005 HURRICANE 122 109 112 104 252/1999 51/2005
MT BAKER 197 174 113 180 311/1999 72/1934 MT BAKER 185 166 111 168 290/1999 56/1934
STEVENS 131 100 131 95 192/1956 24/1941 STEVENS 116 93 125 90 170/1956 17/1941
SNOQUALMIE 131 85 154 79 170/1956 2/1992 SNOQUALMIE 121 71 170 65 153/1974 0/1992
STAMPEDE 144 100 144 88 183/1956 17/1992 STAMPEDE 131 98 134 88 216/1964 9/1992
MISSION 55 46 120 41 86/1983 20/1973 MISSION 45 45 100 36 79/1983 21/1990
CRYSTAL 105 69 152 80 144/1999 16/1981 CRYSTAL 98 71 138 75 130/1999 30/1981
PARADISE 240 174 138 141 327/1956 66/1941 PARADISE 213 172 124 147 302/1972 68/1934
WHITE PASS 95 53 179 51 110/1997 0/1992 WHITE PASS 80 42 190 35 95/1997 0/1992
TIMBERLINE 225 161 140 143 300/1999 57/1981 TIMBERLINE 226 160 141 147 300/1999 71/1977
MEADOWS 199 125 159 104 199/1999 49/2005 MEADOWS 194 123 158 100 190/1982 54/2005
Snowfall: Season Climate % of
Total Average Normal
MT BAKER 786 620 127%
SNOQUALMIE 591 430 137%
PARADISE 947 650 146%
[/size]
[hr]2004-2005 -- weak El Niño[size=small]
CLIMATOLOGICAL SNOWDEPTH INFORMATION CLIMATOLOGICAL SNOWDEPTH INFORMATION
NORTHWEST WEATHER AND AVALANCHE CENTER SEATTLE WASHINGTON NORTHWEST WEATHER AND AVALANCHE CENTER SEATTLE WASHINGTON
DAY 1 MONTH 4 YEAR 2005 DAY 15 MONTH 4 YEAR 2005
DATA IN INCHES, -99 DENOTES MISSING DATA DATA IN INCHES, -99 DENOTES MISSING DATA
CURRENT CLIMATE PER CENT LAST THRU 2004 THRU 2004 CURRENT CLIMATE PER CENT LAST THRU 2004 THRU 2004
DEPTH AVERAGE OF NORMAL YEAR MAX/YEAR MIN/YEAR DEPTH AVERAGE OF NORMAL YEAR MAX/YEAR MIN/YEAR
HURRICANE 42 106 40 95 252/1999 48/1981 HURRICANE 51 112 46 81 252/1999 65/2001
MT BAKER 78 175 45 159 311/1999 72/1934 MT BAKER 79 167 47 138 290/1999 56/1934
STEVENS 49 101 49 79 192/1956 24/1941 STEVENS 39 94 41 61 170/1956 17/1941
SNOQUALMIE 25 86 29 69 170/1956 2/1992 SNOQUALMIE 16 72 22 35 153/1974 0/1992
STAMPEDE 35 101 35 77 183/1956 17/1992 STAMPEDE 26 99 26 52 216/1964 9/1992
MISSION 21 47 45 44 86/1983 20/1973 MISSION 22 47 47 35 79/1983 21/1990
CRYSTAL 31 69 45 83 144/1999 16/1981 CRYSTAL 36 71 51 69 130/1999 30/1981
PARADISE 92 175 53 169 327/1956 66/1941 PARADISE 91 173 53 147 302/1972 68/1934
WHITE PASS 15 54 28 54 110/1997 0/1992 WHITE PASS 3 43 7 25 95/1997 0/1992
TIMBERLINE 74 164 45 182 300/1999 57/1981 TIMBERLINE 88 162 54 163 300/1999 71/1977
MEADOWS 49 127 39 126 199/1999 55/1992 MEADOWS 54 125 43 114 190/1982 54/1992
Snowfall: Season Climate % of
Total Average Normal
MT BAKER 465 620 75%
SNOQUALMIE 216 430 50%
PARADISE 409 650 63%
[/size]
[hr]2002-2003 -- moderate El Niño[size=small]
NOTE: The CLISNO expanded from 7 sites to 11 sites as of March 15, 2003
CLIMATOLOGICAL SNOWDEPTH INFORMATION CLIMATOLOGICAL SNOWDEPTH INFORMATION
NORTHWEST WEATHER AND AVALANCHE CENTER NORTHWEST WEATHER AND AVALANCHE CENTER
ISSUED THROUGH NATIONAL WEATHER SERVICE SEATTLE ISSUED THROUGH NATIONAL WEATHER SERVICE SEATTLE
FOR : DAY 1 MONTH 4 YEAR 2003 FOR : DAY 15 MONTH 4 YEAR 2003
DATA IN INCHES, -99 DENOTES MISSING DATA DATA IN INCHES, -99 DENOTES MISSING DATA
CURRENT CLIMATE PER CENT LAST THRU 2002 THRU 2002 CURRENT CLIMATE PER CENT LAST THRU 2002 THRU 2002
DEPTH AVERAGE OF NORMAL YEAR MAX/YEAR MIN/YEAR DEPTH AVERAGE OF NORMAL YEAR MAX/YEAR MIN/YEAR
HURRICANE 94 107 88 133 252/1999 48/1981 HURRICANE 95 115 83 123 252/1999 65/2001
MT BAKER 171 175 98 186 311/1999 72/1934 MT BAKER 148 168 88 168 290/1999 56/1934
STEVENS 84 102 82 132 192/1956 24/1941 STEVENS 78 95 82 117 170/1956 17/1941
SNOQUALMIE 50 86 58 112 170/1956 2/1992 SNOQUALMIE 42 73 58 100 153/1974 0/1992
STAMPEDE 72 102 71 134 183/1956 17/1992 STAMPEDE -99 100 -99 -99 216/1964 9/1992
MISSION 49 47 104 54 86/1983 20/1973 MISSION 45 49 92 45 79/1983 21/1990
CRYSTAL 76 69 110 96 144/1999 16/1981 CRYSTAL 70 71 99 82 130/1999 30/1981
PARADISE 151 175 86 220 327/1956 66/1941 PARADISE 155 173 90 200 302/1972 68/1934
WHITE PASS 42 54 78 76 110/1997 0/1992 WHITE PASS 30 45 67 55 95/1997 0/1992
TIMBERLINE 168 163 103 253 300/1999 57/1981 TIMBERLINE 175 161 109 220 300/1999 71/1977
MEADOWS 100 124 81 167 199/1999 55/1992 MEADOWS 99 122 81 146 190/1982 54/1992
Snowfall: Season Climate % of
Total Average Normal
MT BAKER 586 620 95%
SNOQUALMIE 277 430 64%
PARADISE 603 650 93%
[/size]
[hr]1997-1998 -- very strong El Niño[size=small]
CLIMATOLOGICAL SNOWDEPTH INFORMATION CLIMATOLOGICAL SNOWDEPTH INFORMATION
NORTHWEST WEATHER AND AVALANCHE CENTER NORTHWEST WEATHER AND AVALANCHE CENTER
ISSUED THROUGH NATIONAL WEATHER SERVICE SEATTLE ISSUED THROUGH NATIONAL WEATHER SERVICE SEATTLE
DAY 1 MONTH 4 YEAR 1998 DAY 15 MONTH 4 YEAR 1998
DATA IN INCHES, -99 DENOTES MISSING DATA DATA IN INCHES, -99 DENOTES MISSING DATA
CURRENT CLIMATE PER CENT THIS DATE CURRENT CLIMATE PER CENT THIS DATE
DEPTH AVERAGE OF NORMAL LAST YEAR DEPTH AVERAGE OF NORMAL LAST YEAR
MT BAKER 163 174 94 205 MT BAKER 154 167 92 200
STEVENS 80 101 79 158 STEVENS 78 94 83 145
SNOQUALMIE 77 86 90 146 SNOQUALMIE 65 72 90 124
STAMPEDE 77 102 75 153 STAMPEDE 71 100 71 135
PARADISE 163 174 94 243 PARADISE 166 172 97 250
WHITE PASS 62 50 124 110 WHITE PASS -99 42 -99 95
MT HOOD 120 120 100 177 MT HOOD 127 119 107 167
Snowfall: Season Climate % of
Total Average Normal
MT BAKER - 620 -
SNOQUALMIE 361 430 84%
PARADISE 674 650 104%
[/size][/tt]
So out of these 5 previous seasons since 1997 with a December 15 snowpack below roughly 70% of normal at these sites, one season ended up being huge (2007-2008, a memorable strong La Niña year), one slightly above-normal (2008-2009, weak La Niña), 2 near-normal (2002-2003, moderate El Niño, and 1997-98, very strong El Niño), and one well-below-normal (2004-2005, weak El Niño, the worst snow year in the Northwest since 1976-77, even since 1940-41 at some sites). Of course, at Snoqualmie Pass (the lowest elevation among these sites) these seasons look more below normal than at higher-elevations sites like Paradise or Baker.
Therefore at most of these sites, there appears to be hardly any correlation between low December 15 snowpack and an overall low snowfall / snowpack throughout the entire season, although there is a definite correlation in that direction at Snoqualmie Pass (albeit weak). Statistically, it is unlikely that this season will end up having catastrophically low snowfall, although that is obviously a possibility in almost any year (except in strong La Niña years, which have near-zero chance of being below normal in the Northwest). The likelihood of a below-normal season at Snoqualmie Pass is clearly greater than at other higher-elevation sites, but that is often the case in many seasons, as Snoqualmie is a very risky basket in which to keep one's wintertime eggs.
The most likely outcome this season is near-normal or perhaps slightly below-normal (i.e. 80-90% of normal snowfall and April 1 snowpack, which is still huge and far beyond what any other regions in the lower 48 normally get). There also remains a significant chance that the season could even end up being above-normal overall, although the likelihood of ending up far-above-normal is quite small given the lack of La Niña conditions in the Pacific (currently ENSO neutral, although SST anomalies have remained slightly negative throughout 2013, see www.cpc.ncep.noaa.gov/products/precip/CW...nso.shtml#discussion ).
Anyway, it's already been a great season so far, with the most late-September snowfall since at least 1972 providing excellent early-October ski conditions, followed by many periods of beautiful sunny weather to enjoy the powder and the corn throughout the autumn months -- and winter hasn't even arrived yet.
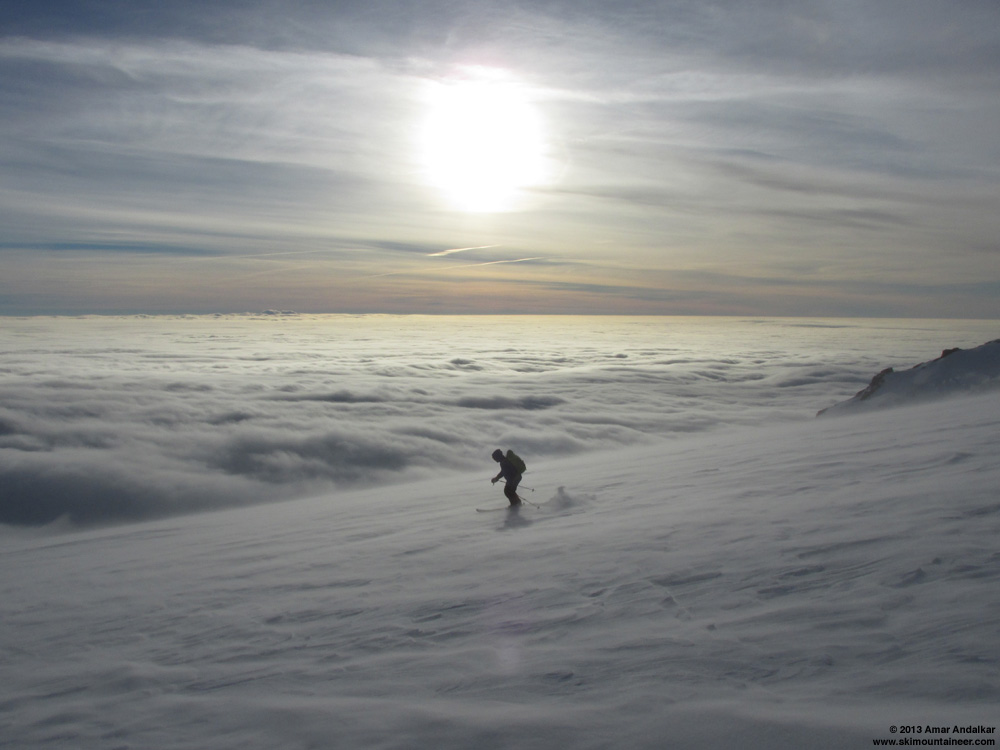
[size=small]Skiing drifts of windblown powder above the sea of clouds, Mount Rainier, December 9, 2013.[/size]
[size=small](Edited to list the ENSO character for each of these 5 seasons.)[/size]
The standard one-parameter measure of an entire season's snowpack is the April 1 snowdepth, which correlates well with total season snowfall at these type of high-snowfall mountain sites. Shown below are the April 1 and April 15 CLISNO data recorded 4 months later on in each of the seasons shown above (except the current season, obviously). Snowfall totals for the entire season are also shown, along with calculated percents of normal, for the only 3 of these sites where such data is readily available.
[tt]2008-2009 -- weak La Niña[size=small]
CLIMATOLOGICAL SNOWDEPTH INFORMATION CLIMATOLOGICAL SNOWDEPTH INFORMATION
NORTHWEST WEATHER AND AVALANCHE CENTER SEATTLE WASHINGTON NORTHWEST WEATHER AND AVALANCHE CENTER SEATTLE WASHINGTON
DAY 1 MONTH 4 YEAR 2009 DAY 15 MONTH 4 YEAR 2009
DATA IN INCHES, -99 DENOTES MISSING DATA DATA IN INCHES, -99 DENOTES MISSING DATA
CURRENT CLIMATE PER CENT LAST THRU 2008 THRU 2008 CURRENT CLIMATE PER CENT LAST THRU 2008 THRU 2008
DEPTH AVERAGE OF NORMAL YEAR MAX/YEAR MIN/YEAR DEPTH AVERAGE OF NORMAL YEAR MAX/YEAR MIN/YEAR
HURRICANE 93 106 88 137 252/1999 42/2005 HURRICANE 92 110 84 122 252/1999 51/2005
MT BAKER 143 174 82 197 311/1999 72/1934 MT BAKER 145 167 87 185 290/1999 56/1934
STEVENS 115 101 114 131 192/1956 24/1941 STEVENS 102 93 110 116 170/1956 17/1941
SNOQUALMIE 102 86 119 131 170/1956 2/1992 SNOQUALMIE 89 72 124 121 153/1974 0/1992
STAMPEDE 127 100 127 144 183/1956 17/1992 STAMPEDE 111 98 113 131 216/1964 9/1992
MISSION 49 46 107 55 86/1983 20/1973 MISSION 44 45 98 45 79/1983 21/1990
CRYSTAL 93 70 133 105 144/1999 16/1981 CRYSTAL 87 72 121 98 130/1999 30/1981
PARADISE 185 175 106 240 327/1956 66/1941 PARADISE 176 172 102 213 302/1972 68/1934
WHITE PASS 98 54 181 95 110/1997 0/1992 WHITE PASS 65 44 148 80 95/1997 0/1992
TIMBERLINE 199 163 122 225 300/1999 57/1981 TIMBERLINE 211 162 130 226 300/1999 71/1977
MEADOWS 166 128 130 199 199/2008 49/2005 MEADOWS 160 125 128 194 194/2008 54/2005
Snowfall: Season Climate % of
Total Average Normal
MT BAKER 548 620 88%
SNOQUALMIE 433 430 101%
PARADISE 734 650 113%
[/size]
[hr]2007-2008 -- strong La Niña[size=small]
CLIMATOLOGICAL SNOWDEPTH INFORMATION CLIMATOLOGICAL SNOWDEPTH INFORMATION
NORTHWEST WEATHER AND AVALANCHE CENTER SEATTLE WASHINGTON NORTHWEST WEATHER AND AVALANCHE CENTER SEATTLE WASHINGTON
DAY 1 MONTH 4 YEAR 2008 DAY 15 MONTH 4 YEAR 2008
DATA IN INCHES, -99 DENOTES MISSING DATA DATA IN INCHES, -99 DENOTES MISSING DATA
CURRENT CLIMATE PER CENT LAST THRU 2007 THRU 2007 CURRENT CLIMATE PER CENT LAST THRU 2007 THRU 2007
DEPTH AVERAGE OF NORMAL YEAR MAX/YEAR MIN/YEAR DEPTH AVERAGE OF NORMAL YEAR MAX/YEAR MIN/YEAR
HURRICANE 137 104 132 108 252/1999 42/2005 HURRICANE 122 109 112 104 252/1999 51/2005
MT BAKER 197 174 113 180 311/1999 72/1934 MT BAKER 185 166 111 168 290/1999 56/1934
STEVENS 131 100 131 95 192/1956 24/1941 STEVENS 116 93 125 90 170/1956 17/1941
SNOQUALMIE 131 85 154 79 170/1956 2/1992 SNOQUALMIE 121 71 170 65 153/1974 0/1992
STAMPEDE 144 100 144 88 183/1956 17/1992 STAMPEDE 131 98 134 88 216/1964 9/1992
MISSION 55 46 120 41 86/1983 20/1973 MISSION 45 45 100 36 79/1983 21/1990
CRYSTAL 105 69 152 80 144/1999 16/1981 CRYSTAL 98 71 138 75 130/1999 30/1981
PARADISE 240 174 138 141 327/1956 66/1941 PARADISE 213 172 124 147 302/1972 68/1934
WHITE PASS 95 53 179 51 110/1997 0/1992 WHITE PASS 80 42 190 35 95/1997 0/1992
TIMBERLINE 225 161 140 143 300/1999 57/1981 TIMBERLINE 226 160 141 147 300/1999 71/1977
MEADOWS 199 125 159 104 199/1999 49/2005 MEADOWS 194 123 158 100 190/1982 54/2005
Snowfall: Season Climate % of
Total Average Normal
MT BAKER 786 620 127%
SNOQUALMIE 591 430 137%
PARADISE 947 650 146%
[/size]
[hr]2004-2005 -- weak El Niño[size=small]
CLIMATOLOGICAL SNOWDEPTH INFORMATION CLIMATOLOGICAL SNOWDEPTH INFORMATION
NORTHWEST WEATHER AND AVALANCHE CENTER SEATTLE WASHINGTON NORTHWEST WEATHER AND AVALANCHE CENTER SEATTLE WASHINGTON
DAY 1 MONTH 4 YEAR 2005 DAY 15 MONTH 4 YEAR 2005
DATA IN INCHES, -99 DENOTES MISSING DATA DATA IN INCHES, -99 DENOTES MISSING DATA
CURRENT CLIMATE PER CENT LAST THRU 2004 THRU 2004 CURRENT CLIMATE PER CENT LAST THRU 2004 THRU 2004
DEPTH AVERAGE OF NORMAL YEAR MAX/YEAR MIN/YEAR DEPTH AVERAGE OF NORMAL YEAR MAX/YEAR MIN/YEAR
HURRICANE 42 106 40 95 252/1999 48/1981 HURRICANE 51 112 46 81 252/1999 65/2001
MT BAKER 78 175 45 159 311/1999 72/1934 MT BAKER 79 167 47 138 290/1999 56/1934
STEVENS 49 101 49 79 192/1956 24/1941 STEVENS 39 94 41 61 170/1956 17/1941
SNOQUALMIE 25 86 29 69 170/1956 2/1992 SNOQUALMIE 16 72 22 35 153/1974 0/1992
STAMPEDE 35 101 35 77 183/1956 17/1992 STAMPEDE 26 99 26 52 216/1964 9/1992
MISSION 21 47 45 44 86/1983 20/1973 MISSION 22 47 47 35 79/1983 21/1990
CRYSTAL 31 69 45 83 144/1999 16/1981 CRYSTAL 36 71 51 69 130/1999 30/1981
PARADISE 92 175 53 169 327/1956 66/1941 PARADISE 91 173 53 147 302/1972 68/1934
WHITE PASS 15 54 28 54 110/1997 0/1992 WHITE PASS 3 43 7 25 95/1997 0/1992
TIMBERLINE 74 164 45 182 300/1999 57/1981 TIMBERLINE 88 162 54 163 300/1999 71/1977
MEADOWS 49 127 39 126 199/1999 55/1992 MEADOWS 54 125 43 114 190/1982 54/1992
Snowfall: Season Climate % of
Total Average Normal
MT BAKER 465 620 75%
SNOQUALMIE 216 430 50%
PARADISE 409 650 63%
[/size]
[hr]2002-2003 -- moderate El Niño[size=small]
NOTE: The CLISNO expanded from 7 sites to 11 sites as of March 15, 2003
CLIMATOLOGICAL SNOWDEPTH INFORMATION CLIMATOLOGICAL SNOWDEPTH INFORMATION
NORTHWEST WEATHER AND AVALANCHE CENTER NORTHWEST WEATHER AND AVALANCHE CENTER
ISSUED THROUGH NATIONAL WEATHER SERVICE SEATTLE ISSUED THROUGH NATIONAL WEATHER SERVICE SEATTLE
FOR : DAY 1 MONTH 4 YEAR 2003 FOR : DAY 15 MONTH 4 YEAR 2003
DATA IN INCHES, -99 DENOTES MISSING DATA DATA IN INCHES, -99 DENOTES MISSING DATA
CURRENT CLIMATE PER CENT LAST THRU 2002 THRU 2002 CURRENT CLIMATE PER CENT LAST THRU 2002 THRU 2002
DEPTH AVERAGE OF NORMAL YEAR MAX/YEAR MIN/YEAR DEPTH AVERAGE OF NORMAL YEAR MAX/YEAR MIN/YEAR
HURRICANE 94 107 88 133 252/1999 48/1981 HURRICANE 95 115 83 123 252/1999 65/2001
MT BAKER 171 175 98 186 311/1999 72/1934 MT BAKER 148 168 88 168 290/1999 56/1934
STEVENS 84 102 82 132 192/1956 24/1941 STEVENS 78 95 82 117 170/1956 17/1941
SNOQUALMIE 50 86 58 112 170/1956 2/1992 SNOQUALMIE 42 73 58 100 153/1974 0/1992
STAMPEDE 72 102 71 134 183/1956 17/1992 STAMPEDE -99 100 -99 -99 216/1964 9/1992
MISSION 49 47 104 54 86/1983 20/1973 MISSION 45 49 92 45 79/1983 21/1990
CRYSTAL 76 69 110 96 144/1999 16/1981 CRYSTAL 70 71 99 82 130/1999 30/1981
PARADISE 151 175 86 220 327/1956 66/1941 PARADISE 155 173 90 200 302/1972 68/1934
WHITE PASS 42 54 78 76 110/1997 0/1992 WHITE PASS 30 45 67 55 95/1997 0/1992
TIMBERLINE 168 163 103 253 300/1999 57/1981 TIMBERLINE 175 161 109 220 300/1999 71/1977
MEADOWS 100 124 81 167 199/1999 55/1992 MEADOWS 99 122 81 146 190/1982 54/1992
Snowfall: Season Climate % of
Total Average Normal
MT BAKER 586 620 95%
SNOQUALMIE 277 430 64%
PARADISE 603 650 93%
[/size]
[hr]1997-1998 -- very strong El Niño[size=small]
CLIMATOLOGICAL SNOWDEPTH INFORMATION CLIMATOLOGICAL SNOWDEPTH INFORMATION
NORTHWEST WEATHER AND AVALANCHE CENTER NORTHWEST WEATHER AND AVALANCHE CENTER
ISSUED THROUGH NATIONAL WEATHER SERVICE SEATTLE ISSUED THROUGH NATIONAL WEATHER SERVICE SEATTLE
DAY 1 MONTH 4 YEAR 1998 DAY 15 MONTH 4 YEAR 1998
DATA IN INCHES, -99 DENOTES MISSING DATA DATA IN INCHES, -99 DENOTES MISSING DATA
CURRENT CLIMATE PER CENT THIS DATE CURRENT CLIMATE PER CENT THIS DATE
DEPTH AVERAGE OF NORMAL LAST YEAR DEPTH AVERAGE OF NORMAL LAST YEAR
MT BAKER 163 174 94 205 MT BAKER 154 167 92 200
STEVENS 80 101 79 158 STEVENS 78 94 83 145
SNOQUALMIE 77 86 90 146 SNOQUALMIE 65 72 90 124
STAMPEDE 77 102 75 153 STAMPEDE 71 100 71 135
PARADISE 163 174 94 243 PARADISE 166 172 97 250
WHITE PASS 62 50 124 110 WHITE PASS -99 42 -99 95
MT HOOD 120 120 100 177 MT HOOD 127 119 107 167
Snowfall: Season Climate % of
Total Average Normal
MT BAKER - 620 -
SNOQUALMIE 361 430 84%
PARADISE 674 650 104%
[/size][/tt]
So out of these 5 previous seasons since 1997 with a December 15 snowpack below roughly 70% of normal at these sites, one season ended up being huge (2007-2008, a memorable strong La Niña year), one slightly above-normal (2008-2009, weak La Niña), 2 near-normal (2002-2003, moderate El Niño, and 1997-98, very strong El Niño), and one well-below-normal (2004-2005, weak El Niño, the worst snow year in the Northwest since 1976-77, even since 1940-41 at some sites). Of course, at Snoqualmie Pass (the lowest elevation among these sites) these seasons look more below normal than at higher-elevations sites like Paradise or Baker.
Therefore at most of these sites, there appears to be hardly any correlation between low December 15 snowpack and an overall low snowfall / snowpack throughout the entire season, although there is a definite correlation in that direction at Snoqualmie Pass (albeit weak). Statistically, it is unlikely that this season will end up having catastrophically low snowfall, although that is obviously a possibility in almost any year (except in strong La Niña years, which have near-zero chance of being below normal in the Northwest). The likelihood of a below-normal season at Snoqualmie Pass is clearly greater than at other higher-elevation sites, but that is often the case in many seasons, as Snoqualmie is a very risky basket in which to keep one's wintertime eggs.
The most likely outcome this season is near-normal or perhaps slightly below-normal (i.e. 80-90% of normal snowfall and April 1 snowpack, which is still huge and far beyond what any other regions in the lower 48 normally get). There also remains a significant chance that the season could even end up being above-normal overall, although the likelihood of ending up far-above-normal is quite small given the lack of La Niña conditions in the Pacific (currently ENSO neutral, although SST anomalies have remained slightly negative throughout 2013, see www.cpc.ncep.noaa.gov/products/precip/CW...nso.shtml#discussion ).
Anyway, it's already been a great season so far, with the most late-September snowfall since at least 1972 providing excellent early-October ski conditions, followed by many periods of beautiful sunny weather to enjoy the powder and the corn throughout the autumn months -- and winter hasn't even arrived yet.
[size=small]Skiing drifts of windblown powder above the sea of clouds, Mount Rainier, December 9, 2013.[/size]
[size=small](Edited to list the ENSO character for each of these 5 seasons.)[/size]
Please Log in or Create an account to join the conversation.
- cumulus
-
- User
-
Less
More
- Posts: 116
- Thank you received: 0
12 years 6 months ago #211306
by cumulus
Replied by cumulus on topic Re: How unusual is the current low PNW snowpack?
Thanks for doing the science! Beautiful pic too!
After all the statistics however it seems a bit disingenuous and overstated to be labeling Snoqualmie as a "a very risky basket." Even comparing it relatively as you do it still delivers quite nicely. It also remains the ski option with the lowest carbon footprint to the largest metropolitan area in the state of Washington. Given the accumulating science of emissions on weather patterns and the driving required* to access skiing, this to me would seem pertinent and anything but risky. Not to mention the character building aspect... it's not for nothing all the best skiers cut their teeth in snocrummy land.")
*with the exception of course of the occasional entirely human powered ski excursion
After all the statistics however it seems a bit disingenuous and overstated to be labeling Snoqualmie as a "a very risky basket." Even comparing it relatively as you do it still delivers quite nicely. It also remains the ski option with the lowest carbon footprint to the largest metropolitan area in the state of Washington. Given the accumulating science of emissions on weather patterns and the driving required* to access skiing, this to me would seem pertinent and anything but risky. Not to mention the character building aspect... it's not for nothing all the best skiers cut their teeth in snocrummy land.
*with the exception of course of the occasional entirely human powered ski excursion
Please Log in or Create an account to join the conversation.
- sprice
-
- User
-
Less
More
- Posts: 66
- Thank you received: 0
12 years 6 months ago #211314
by sprice
Replied by sprice on topic Re: How unusual is the current low PNW snowpack?
Cliff mass had a great explanation post for the current situation
cliffmass.blogspot.com/2013/12/an-unusually-dry-fall.html
cliffmass.blogspot.com/2013/12/an-unusually-dry-fall.html
Please Log in or Create an account to join the conversation.
- knitvt
-
- User
-
Less
More
- Posts: 44
- Thank you received: 0
12 years 6 months ago #211315
by knitvt
Replied by knitvt on topic Re: How unusual is the current low PNW snowpack?
Thanks for pulling all that data! Really interesting to see.
Please Log in or Create an account to join the conversation.
- pipedream
-
- User
-
Less
More
- Posts: 629
- Thank you received: 0
12 years 6 months ago #211316
by pipedream
Replied by pipedream on topic Re: How unusual is the current low PNW snowpack?
Thanks for confirming my hypotheses, Amar! While we're off to a slow start, that doesn't mean we won't still have a great season. It's all about perspective and making the best out of the hand we've been dealt.
As a recent transplant to the region (~7 years ago), it's easy to falsely generalize about the current state of the snowpack, weather patterns, etc. Climate operates on the scale of decades, what we're seeing is likely within the overall error range / uncertainty.
While I dodged the bullet in 2004-2005, the slow starts of 2007-2008 and 2008-2009 are still fresh in my memory. IMHO, the season starts when Mt. Baker opens and ends when the base of Alpental melts out. In 2008-2009, Mt. Baker didn't open until Dec. 14 and I recall Ski Patrol opening the 7th Heaven chairlift at Steven's Pass on Christmas Day. In 2007-2008, Mt. Baker barely made it open before December (Nov. 29th), but if you recall it snowed 13+ feet in March at Snoqualmie Pass and Alpental spun their lifts until early June!
So while we're certainly off to a slow start, just take a deep breath and put it into scientific perspective. There's still plenty of time for Old Man Winter to deliver...
Please Log in or Create an account to join the conversation.