
Turns All Year, Proven

A data collaboration
We read 15,357 of your trip reports — every one from 2001 to 2026 — and ran them through a snow-surface classifier. Here is the rhythm of a Cascade ski year, told entirely in your own words.
Twenty-five years ago, someone parked at Crystal, skinned up Bullion Basin, and came home to type up the day. Fifteen thousand three hundred and fifty-seven reports later, that habit has quietly built one of the most remarkable records of backcountry skiing anywhere on Earth — a day-by-day diary of what the snow in the Pacific Northwest actually does, kept by the only people who were standing on it.
We read all of it. Every report from January 2001 to the present, and passed each through a classifier that reads the prose and estimates the surface a skier met that day — powder, corn, hard and icy, heavy and wet, or wind-packed. What comes back is not a forecast and not a snapshot. It is the lived rhythm of a Cascade year. And the first thing it says, loud and clear, is that the name of this community was never a slogan.
The name is not a joke
When the community actually goes skiing
Ask a non-skier when ski season is and they will say December to March. Your reports tell a completely different story. The two busiest months of the entire archive are May and June — each one busier than any month of true winter. Skiing does not stop when the lifts do; it simply moves uphill and onto the volcanoes. Even the quietest month, September, still carries nearly 400 reports.
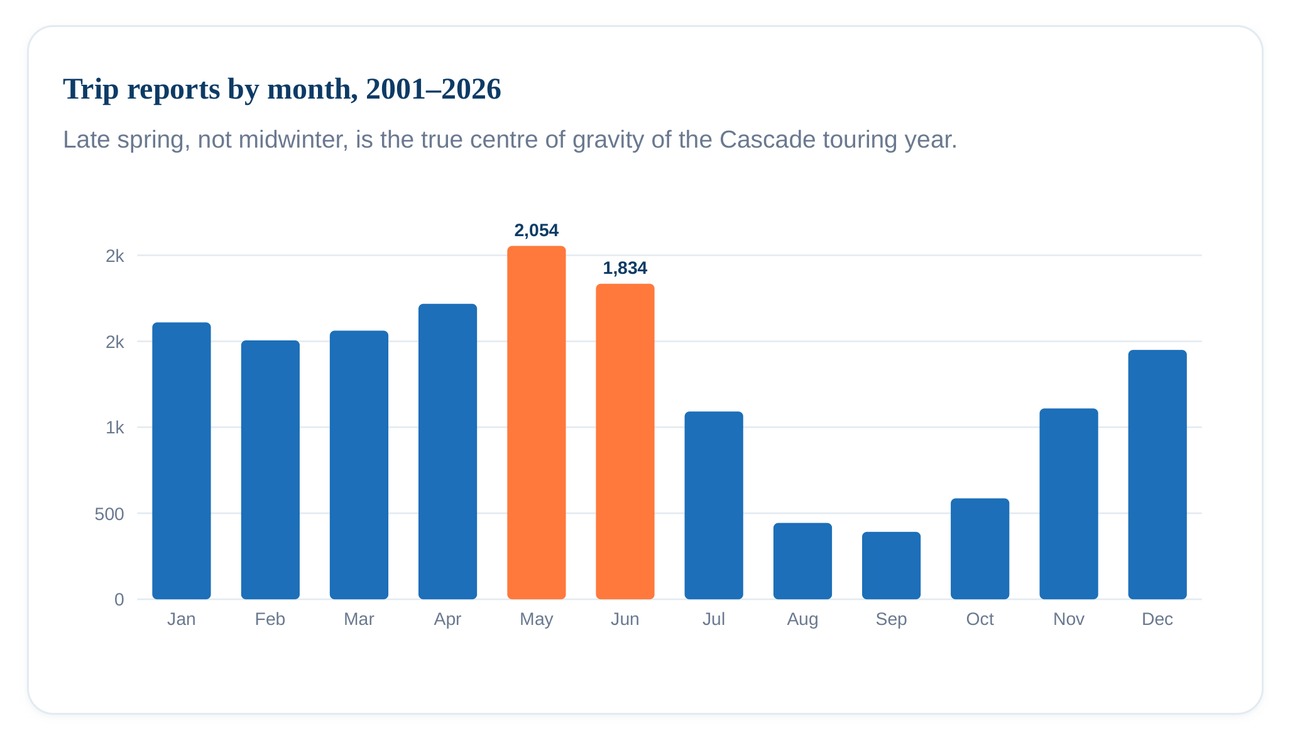
May and June each out-report every winter month. "Turns all year" isn't aspiration — it's the shape of the data.
Powder in winter, corn all summer
The great changeover
The calendar tells you when people ski. The classifier tells you what they find — and here the year has a beautiful, almost tidal structure. From November through February, the surface a tourer meets is powder more than half the time. Then, across April and May, the two lines cross: powder gives way to corn, the smooth, forgiving spring surface that forms when a wet snowpack melts and refreezes each night. By July, corn is the surface in half of all reports — the reward for carrying skis up a volcano in a t-shirt.
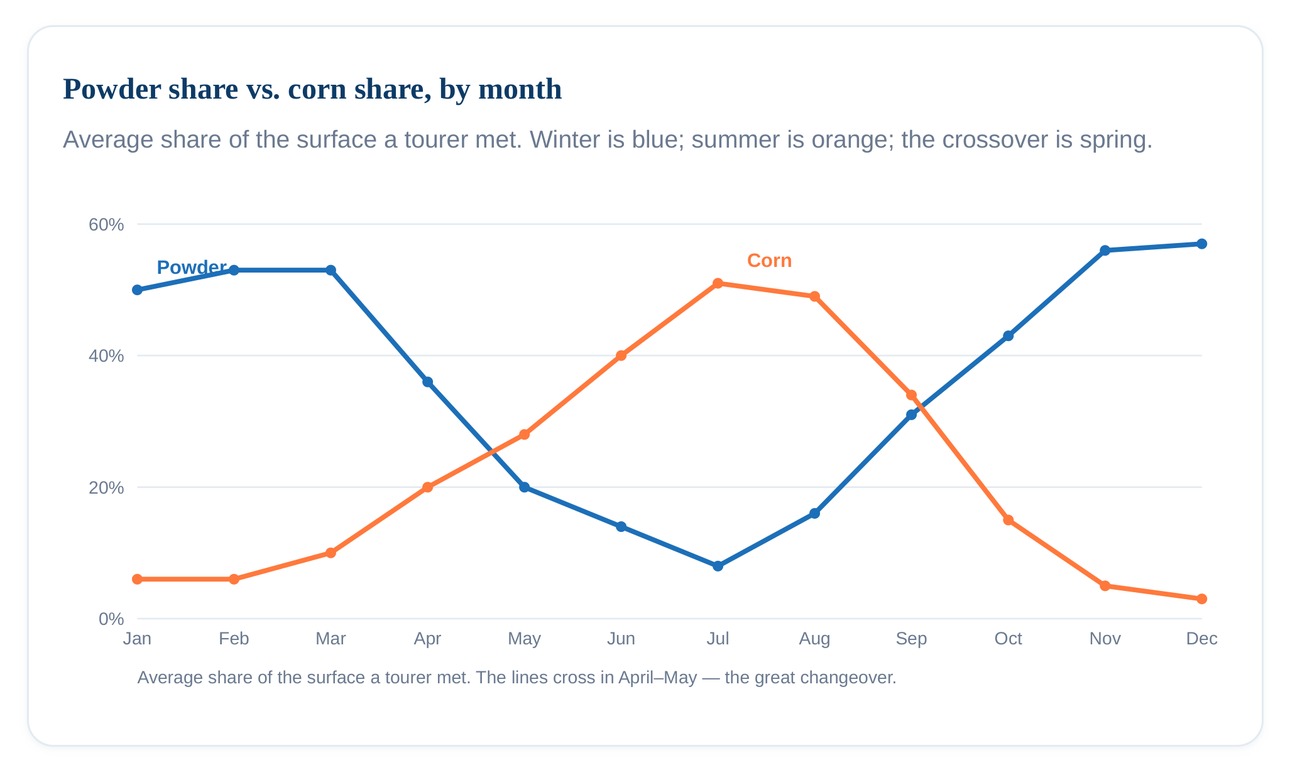
Notice the one month that belongs to neither: May. As the powder fades but the corn cycle hasn't fully locked in, May is when the Cascades serve up their most infamous surface — heavy, wet, grabby "Cascade concrete," which peaks at nearly a quarter of all reports that month before the summer freeze–thaw cleans everything up. If you have ever had a truly humbling ski day, the odds say it was in May.
What you actually meet
The Cascade snow stereotype, tested
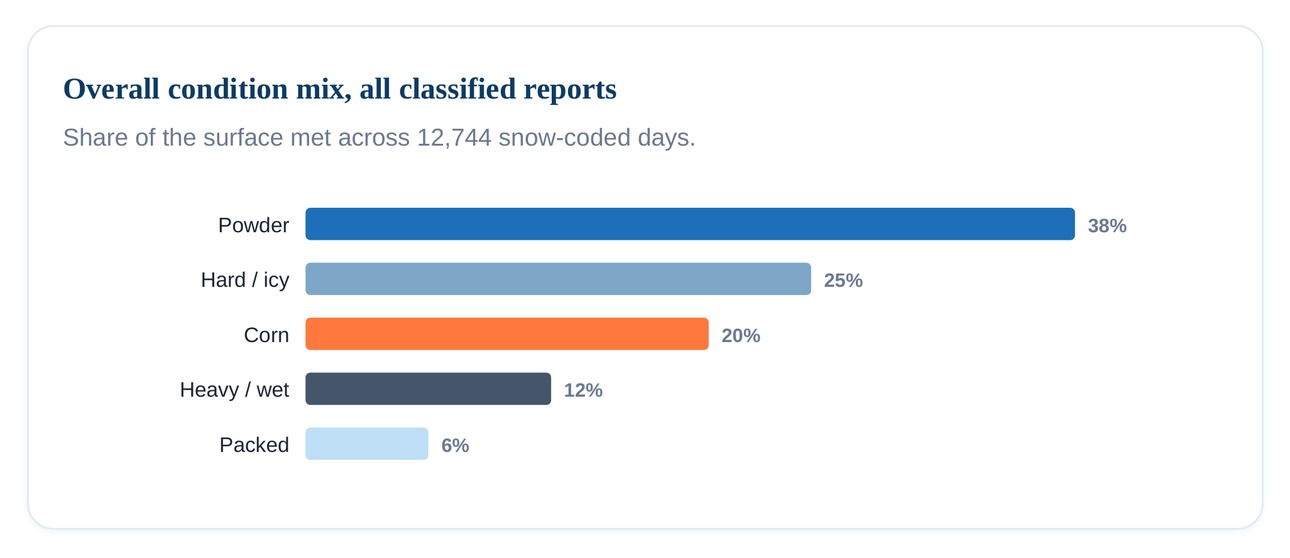
The Pacific Northwest has a reputation — rain, mank, concrete. Your own reports politely disagree. Pooled across all 12,744 classified days, the single most common surface in the Cascades is powder, at 38% — comfortably ahead of everything else. Hard and icy morning snow is the steady runner-up (a quarter of days), which any dawn-patrol skier who has scratched down a firm slope before the sun hits will recognise instantly. Genuinely heavy, wet snow? Real, but seasonal, and only 12% of the record overall.
Do the trip reports hold up?
We checked our work — twice
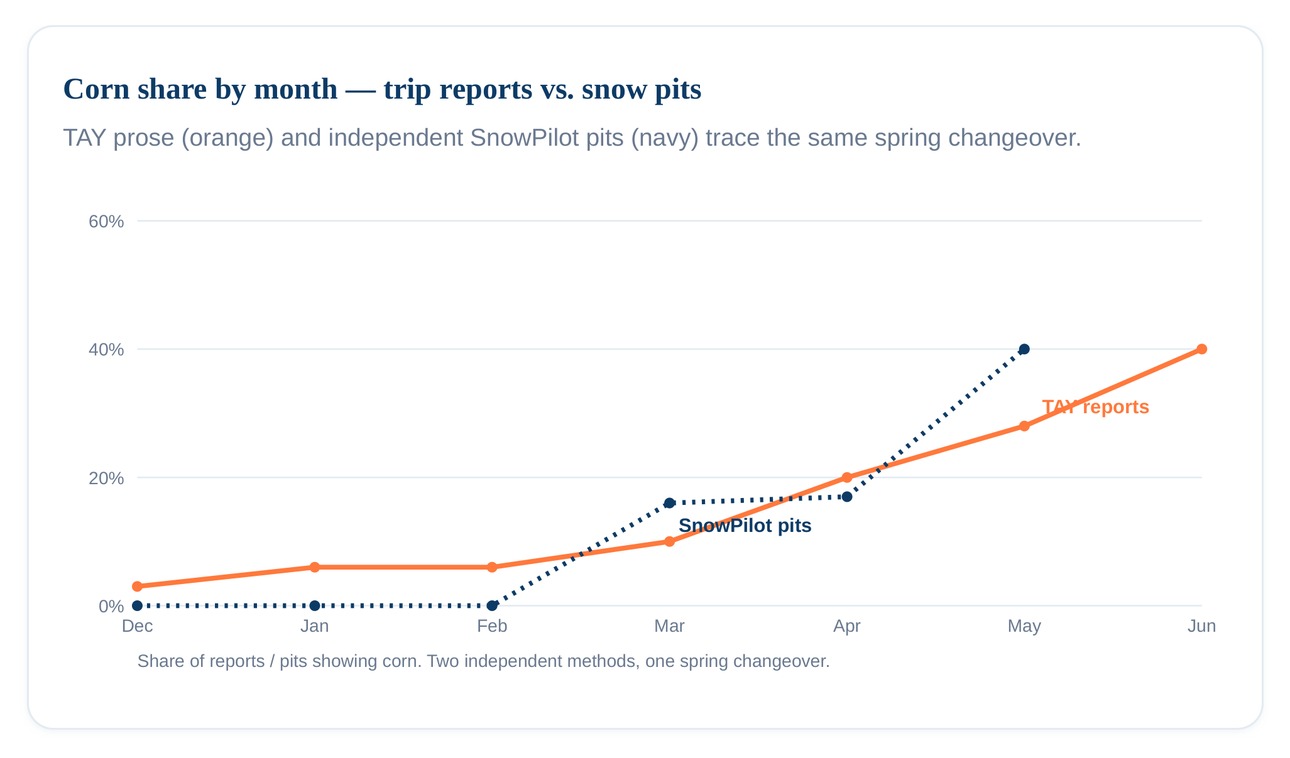
Fair question: can you really learn snow science from forum posts? We wondered too — so we put the trip reports up against two completely independent records of the same mountains. First, 1,227 SnowPilot snow pits dug in the Cascades by avalanche professionals and citizen scientists — hard, physical measurements, no prose involved. Then twenty years of the Stevens Pass weather station, a machine that has never read a trip report in its life.
They tell the same story. Dig a pit or read a thousand reports — either way, corn is essentially absent all winter and switches on in spring, and both records place the changeover in the same weeks of April and May.
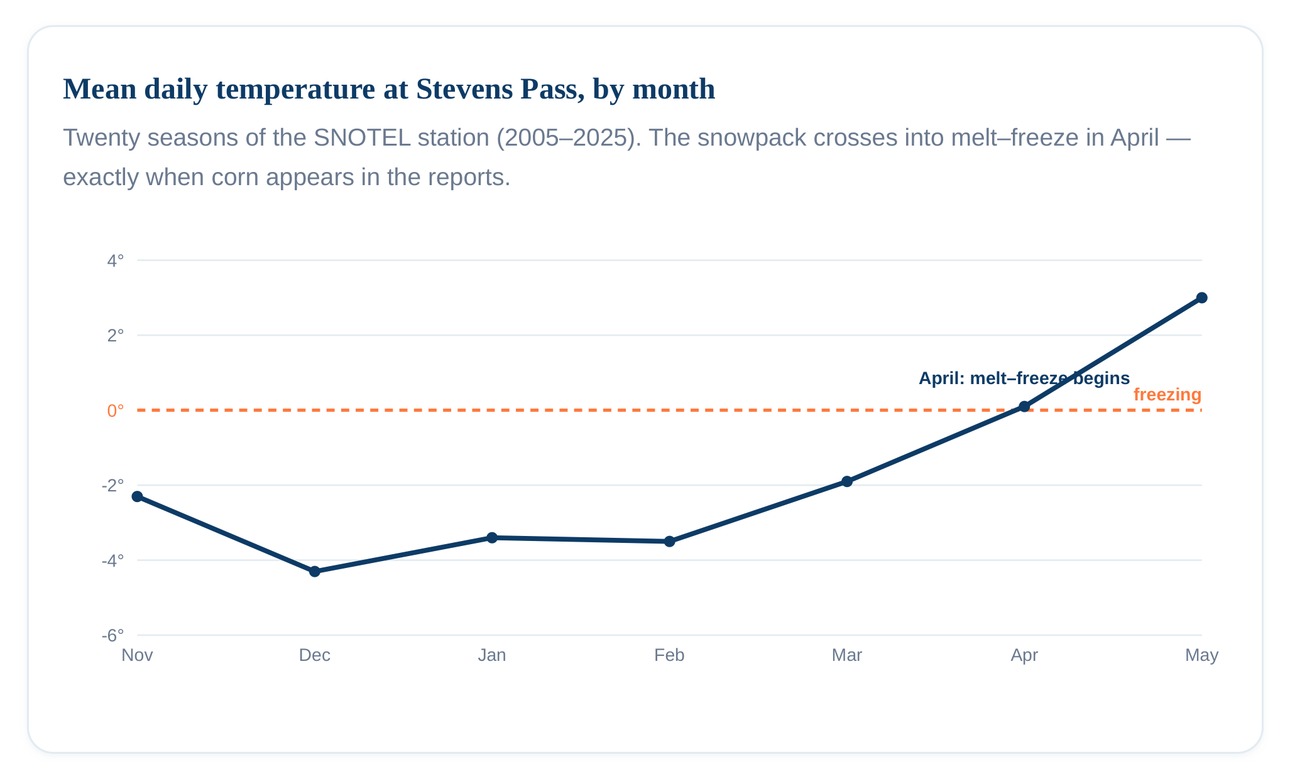
And the weather station tells us why. Corn is a temperature story: it needs a snowpack that melts by day and refreezes by night. Watch what happens at Stevens Pass. All winter the mountain sits well below freezing — only about one day in six climbs above 0°C. Then, in April, the line crosses zero: suddenly half of all days go above freezing. Melt–freeze begins, and corn is born. By May, 88% of days break freezing and the volcanoes enter full corn season.
The home hills
Where the turns happen
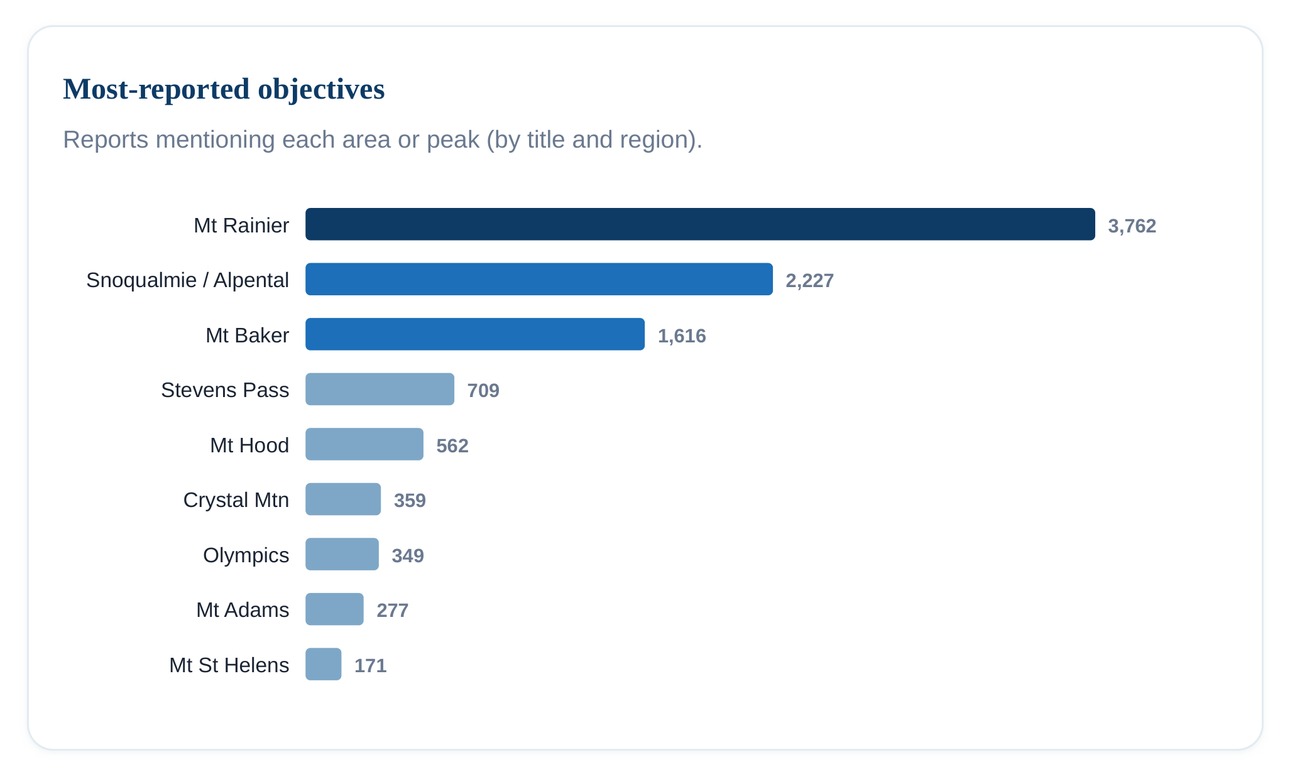
One mountain towers over the archive the way it towers over Seattle. Mount Rainier appears in more reports than any other objective by a wide margin — its Muir snowfield and Emmons Glacier are the closest thing the region has to a year-round ski resort. Behind it sit the near-town classics of Snoqualmie and Alpental, the glaciated giants of Baker and Hood, and a long tail of volcanoes — Adams, St. Helens, Glacier Peak — that fill the summer corn calendar.
Put it all together and you have the whole shape of a Northwest ski life in one breath: chase powder in the dark months, brave the mank in May, and harvest corn off the volcanoes all summer long — with Rainier watching over all of it.
How we did this
SastrugiLab read all 15,357 Turns All Year trip reports and used a purpose-built text classifier (tay_en_v2) to estimate the snow surface described in each one, as fractional shares across five archetypes. The classifier agrees with hand-labelled reports about 79% of the time — roughly four in five — so treat the month-to-month patterns as solid and any single number as a good estimate rather than a decimal-perfect truth. The cross-checks use 1,227 SnowPilot pits within the Cascades and the Stevens Pass SNOTEL record (2005–2025). Report volume reflects when the community wrote things down — the archive's most prolific years were its late-2000s golden era of forum trip reports — so we lean on the seasonal and geographic signal, which is robust, rather than year-over-year counts.
SastrugiLab is a snow-science research group building the most detailed picture yet of what backcountry riders actually meet on the mountain — not the forecast, not the season average, but the real surface underfoot, place by place and week by week. We gather and read hundreds of thousands of first-hand observations from touring communities, snow-pit networks and weather stations worldwide, then turn them into honest, confidence-rated snow profiles.
The goal is simple: help skiers and splitboarders choose the right gear and set the right expectations for wherever — and whenever — they're heading. Records like the one the Turns All Year community has kept for a quarter century are exactly the kind of ground truth that makes this possible. Our thanks to everyone who ever came home tired and still sat down to write up the day.
Turns All Year × SastrugiLab. Analysis and charts by SastrugiLab from the Turns All Year trip-report archive, published in partnership. Sources: 15,357 TAY reports (2001–2026), 1,227 SnowPilot Cascade pits, Stevens Pass SNOTEL (2005–2025). Data through July 2026.
Conversation
Post a Comment
Please login first: